

Congratulations, you’ve saved hard and received your brand-new PC or the hardware upgrade you were looking for, and now it’s time to enjoy the extra performance.
Not so fast, young buck, because you need to quantify just how much extra power is under the hood, ensuring everything is running tickety-boo. This is where benchmarks come into their own, but there are so many these days – some good, some mediocre – so let me guide you on what I think you should always have on your PC. I have compiled a list of free tools that will help you identify the specs and measure the performance of your new-and-improved machine. And besides, the geeks in us always want to see what their new PCs are capable of.
CPU-Z
Developed by CPUID. Download Link (4.5MB).
CPU-Z is an information and hardware profiling tool that reads system details directly from your machine before displaying them in a clean and easy-to-read interface. CPU-Z can show you plenty of CPU-related details, such as the manufacturer, model name, core count, frequency, cache capacity, socket, and voltage. It can also detect the memory type and speed, motherboard model and BIOS version, and even some information about the GPU. Not bad for an application that weighs in at 4.5MB.
The most important bits to look for are the CPU model, core count, and clock speeds, to ensure your chip is running at official speeds and that all cores are enabled. Next, you can browse to the memory section to verify that your RAM is running at its advertised speed, especially after enabling XMP/EXPO profiles in the BIOS. Sometimes, these profiles don’t activate properly due to instability – from the motherboard or the CPU’s integrated memory controller – forcing the RAM into a safer, slower state without informing you of the change. There’s really no need to leave CPU or memory performance on the table when you have CPU-Z at your side.
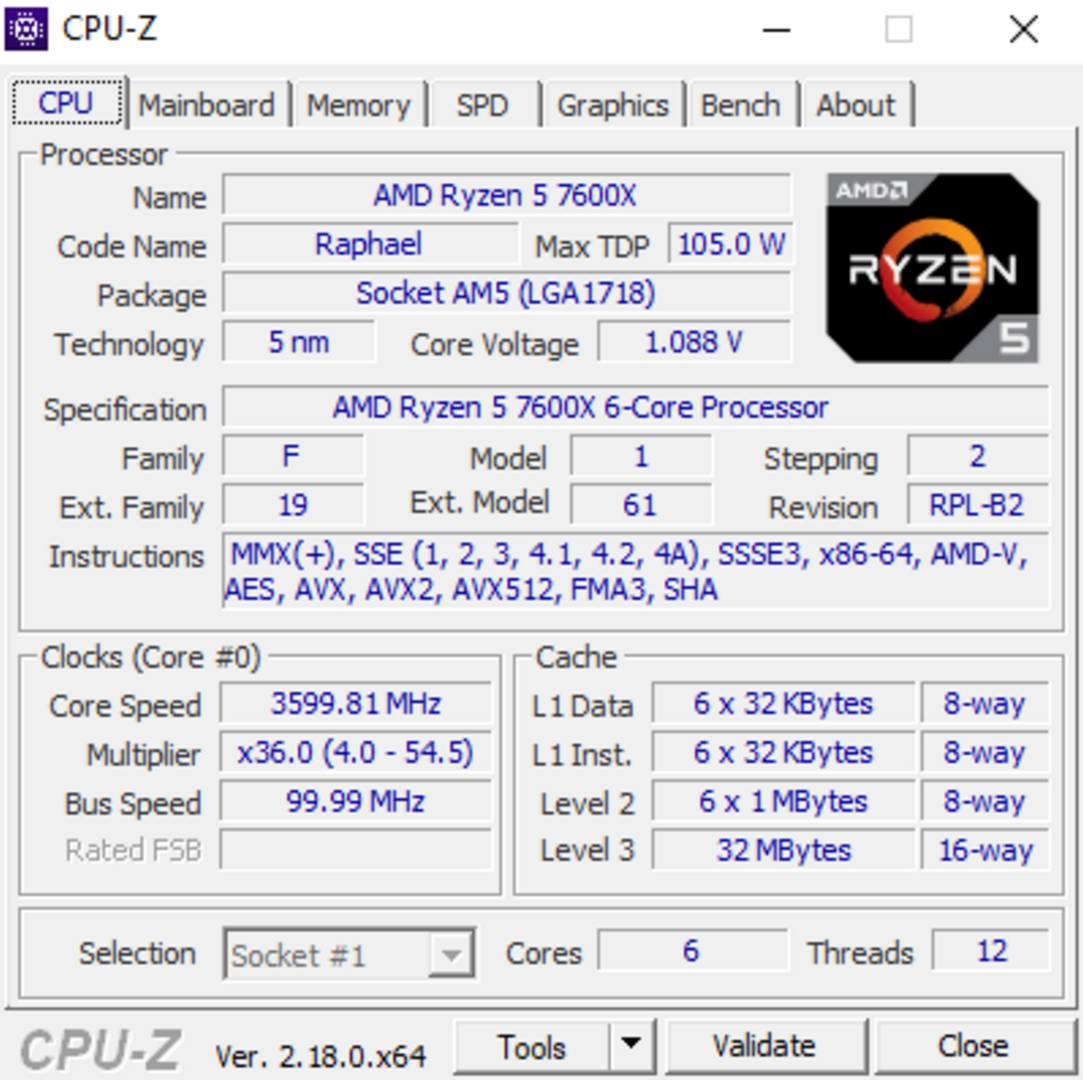
For my part, I find it handy to confirm my overclock or underclock is active, and that my RAM timings are applied correctly. Also, since I want to maintain a 1:1 ratio between my RAM and my Ryzen 5 7600X‘s Infinity Fabric, CPU-Z can tell me if that’s the case. Lastly, this little app includes a small benchmark tool that measures the performance of your processor and validates it against other chips.
GPU-Z
Developed by TechPowerUp. Download Link (10.9MB).
GPU-Z is pretty much a GPU-specific alternative to CPU-Z. It offers plenty of GPU-related specs and measurements, including model name, BIOS version, VRAM type, capacity, frequency, and even PCIe speed. The latter is quite handy to ensure that your dedicated graphics card is linked to the CPU at the highest speed, thus avoiding unnecessary performance bottlenecks. This is especially important for low-VRAM graphics cards, by which I mean 8GB or smaller, as they tend to more frequently access the system memory via the PCIe interface to retrieve data that doesn’t fit inside the video buffer.
The app also shows you which technologies are supported by your GPU, such as the DirectX version, ray tracing, or Nvidia PhysX. Furthermore, GPU-Z displays sensor data, giving insight into your card’s temperature, VRAM usage, fan speed, and voltage. On modern and premium cards, the app can even read memory and GPU hotspot temperatures, which come in handy when overclocking.
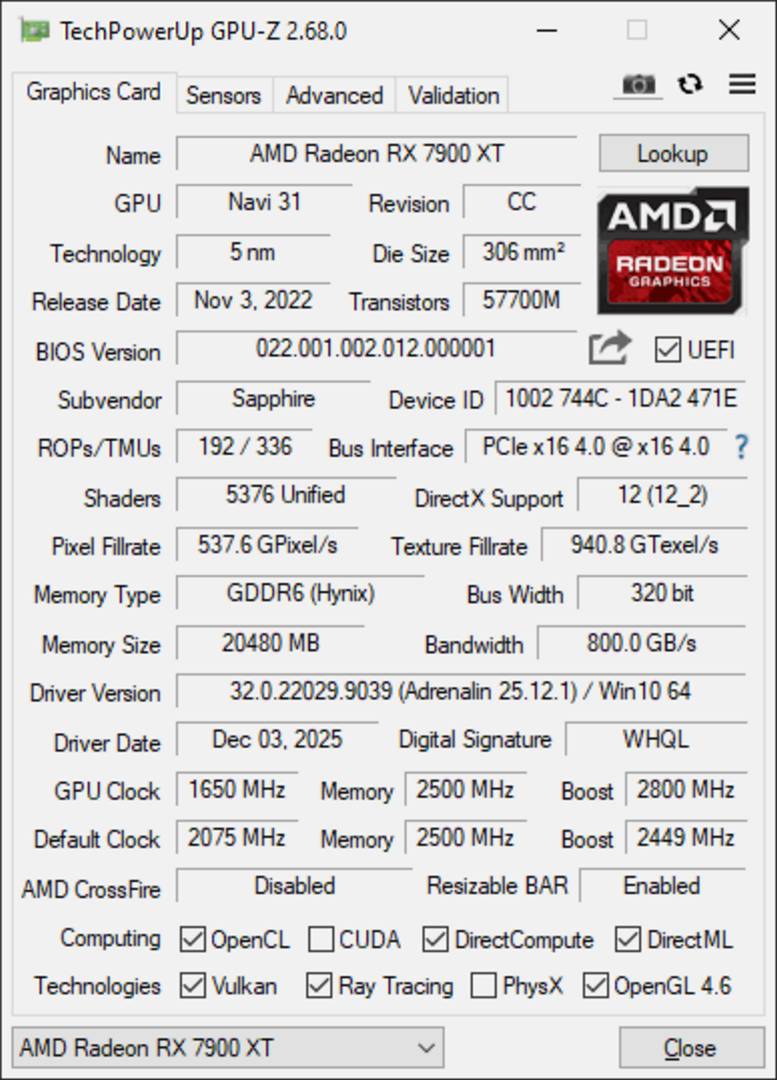
Since graphics cards are more prone to counterfeits due to their easily flashable firmware, GPU-Z can be a money saver, letting you compare your card’s specs with the official ones. There is even a quick render test to ensure the card doesn’t have some crippling defect that stops it from operating beyond basic 2D rendering. And if you still have doubts, you can always launch the validation process, which gives you a link containing your GPU’s specs that you can cross reference against tech forums for further verification.
HWInfo
Developed by Martin Malík, REALiX. Download Link (18.3MB).
HWInfo is a deep system diagnostics plus real-time monitoring software that allows you to check every sensor and measurable aspect of your machine. Whether you are looking for per-core CPU frequency, temperature, power, RAM speed, HDD/SDD temperature, or network speed, if the data is accessible, HWinfo will likely find and show it. This makes it a strong tool for those tuning their hardware, as everything can be conveniently monitored from one place. I especially like how it displays the current and maximum values, which allows me to see if my overclocks are causing any overheating.
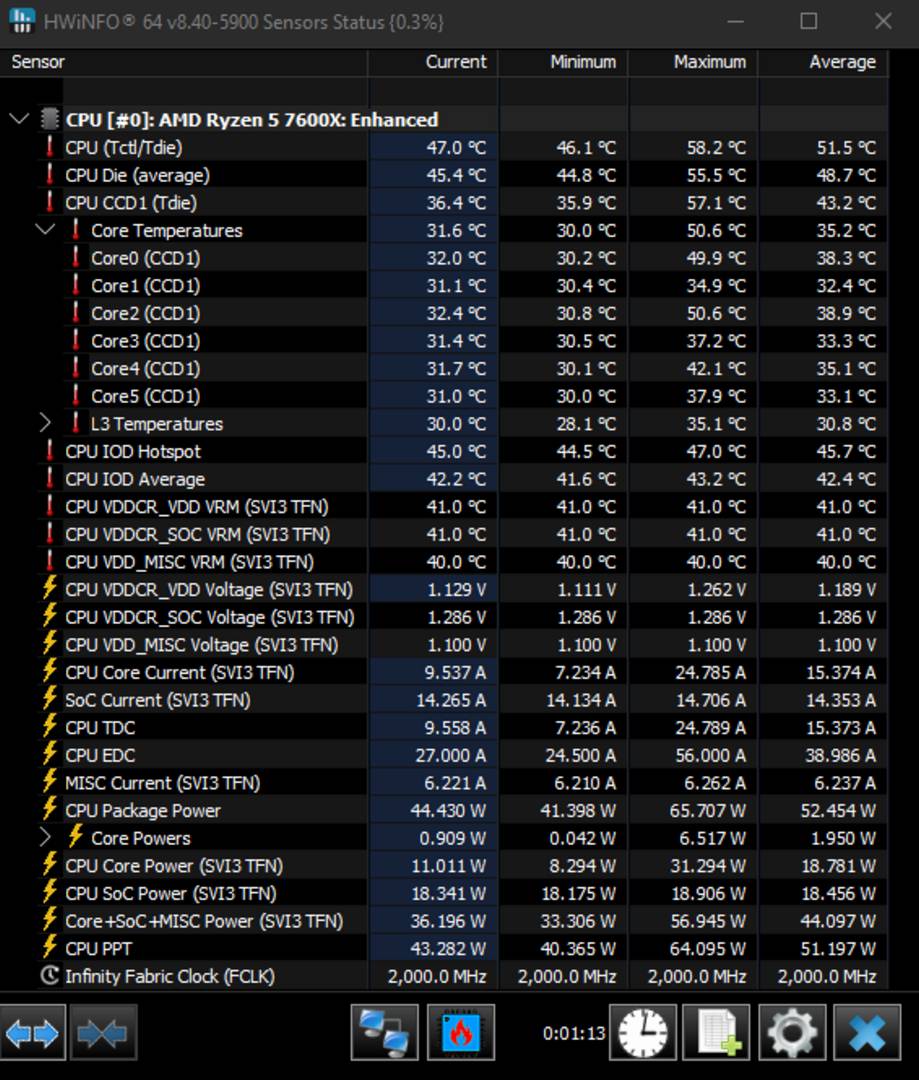
HWinfo also shows information about your CPU and GPU, much like CPU-Z and GPU-Z, but most enthusiasts use it for its sensor capabilities. The app also allows you to set up an OSD that overlays preferred sensors on top of your games, if you like to keep an eye out for any potential overheating or bottlenecks. Personally, I prefer delegating this part to CapFrameX – more on that later. To put it simply, HWinfo is the one tool that tells you if each part of your system is reaching its optimal speed.
CrystalDiskMark
Developed by hiyohiyo. Download Link (12.8MB).
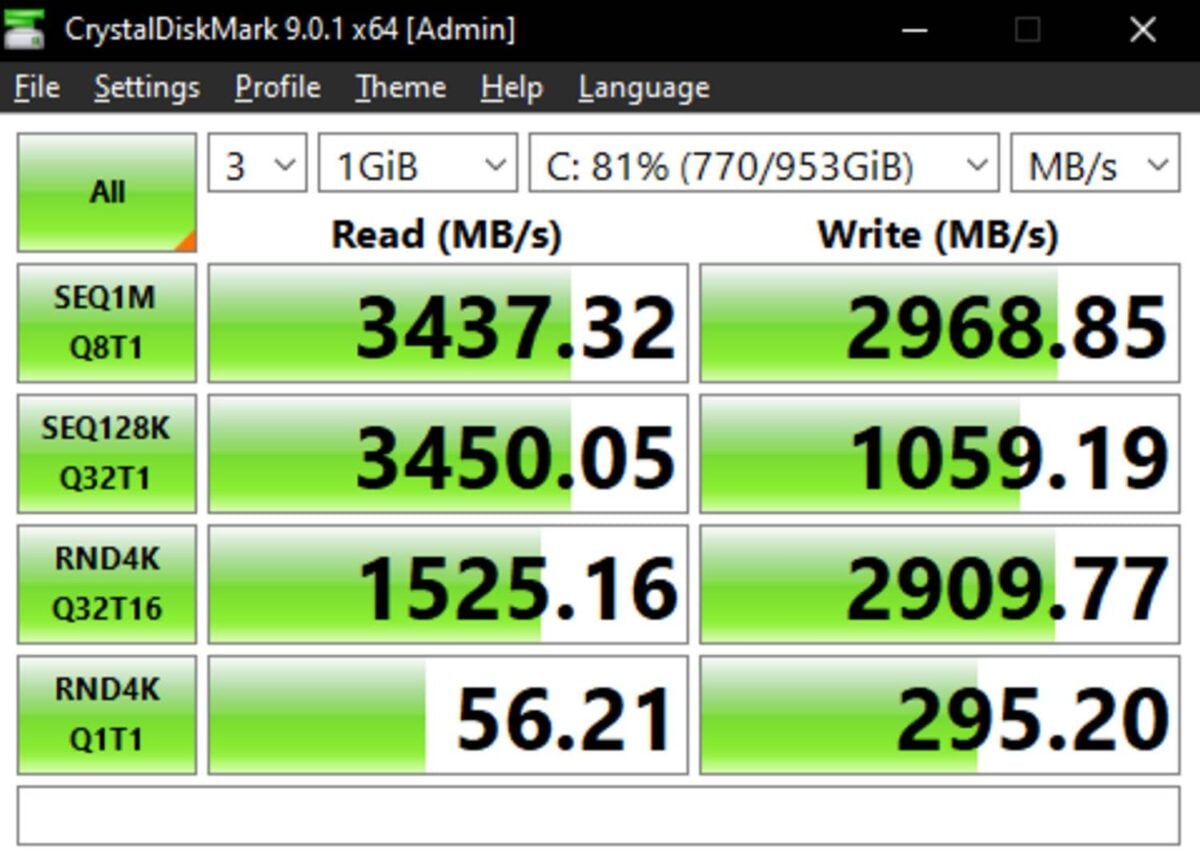
CrystalDiskMark is a storage-benchmarking tool that measures the speed of your HDDs, SSDs, and even flash drives. It features a simple and easy-to-read interface, providing you with the important information right away. This tool measures the read and write speeds of your storage drives, including sequential speeds, as well as random 4K access – which is important for a responsive system. Since you can configure it for long and heavy tests, CrystalDiskMark can also reveal the true steady-state speed of your SSD whenever the typical fast DRAM cache becomes overwhelmed.
CrystalDiskMark is also a strong verification tool against counterfeit drives, especially flash-based offerings, which are easier to imitate. While legit modern NVMe SSDs are all pretty much fast enough for any consumer task, counterfeit ones tend to use cheap or outright rejected NAND flash chips that can’t handle sustained speeds for long. Thus, subjecting them to this particular built-in test can reveal any atypical behaviour. Just keep in mind that even legit drives often miss their advertised speed by a small margin, especially when they are near full or running the operating system.
If you buy a second-hand SSD or simply want to test your older drive, CrystalDiskMark is worth coupling with CrystalDiskInfo. The latter allows you to extract the drives’ S.M.A.R.T. data, which contains plenty of information about the state and past life of the drive. Most notably, it can give you a snapshot of the health of your drive, which is important for SSDs as, by design, they have only a limited number of write cycles.
Cinebench
Developed by Maxon. Download Link (1.3GB Zip).
If, after using the apps listed above, you still have doubts about your hardware, specifically the CPU, Cinebench is the right tool to give you a final, definitive answer. This benchmarking software is made to push your CPU to its limits while giving you a score that you can compare to trusted reviews, ensuring your CPU is operating as it should be. To do so, Cinebench renders a single- or multi-threaded real-world 3D scene and gives you a score that you can compare to other CPUs, including head-to-heads with other brands and chip generations. While doing so, it also stresses your CPU heavily, which has the positive effect of revealing unstable overclocks.

Note that I intentionally dismissed the newer Cinebench 2026 in favour of 2024 as the former seems to have issues launching on Windows 10, limiting its reach. That said, any Cinebench version would is worth investigating, so feel free to download the one you like. Cinebench can also test your GPU, but the next app on this list is better suited for this task.
3DMark
Developed by UL Solutions. Download via Steam (Size varies).
3DMark is a GPU benchmark that renders real-time 3D scenes to test your graphics card’s performance accurately. The tool offers various tests ranging from easy ones, ostensibly for old hardware, to highly complex tests featuring the latest technologies such as ray tracing. The latter can be quite intense, with plenty of effects going around at the same time, resulting in high GPU utilisation.
Overclockers tend to prefer 3DMark over the so-called power virus tests thanks to its more realistic load, which doesn’t hammer the GPU unnecessarily. It is also a more accurate test for gamers, as it can load the CPU and GPU at the same time, revealing any instabilities that can result from an unstable power supply or overheating.
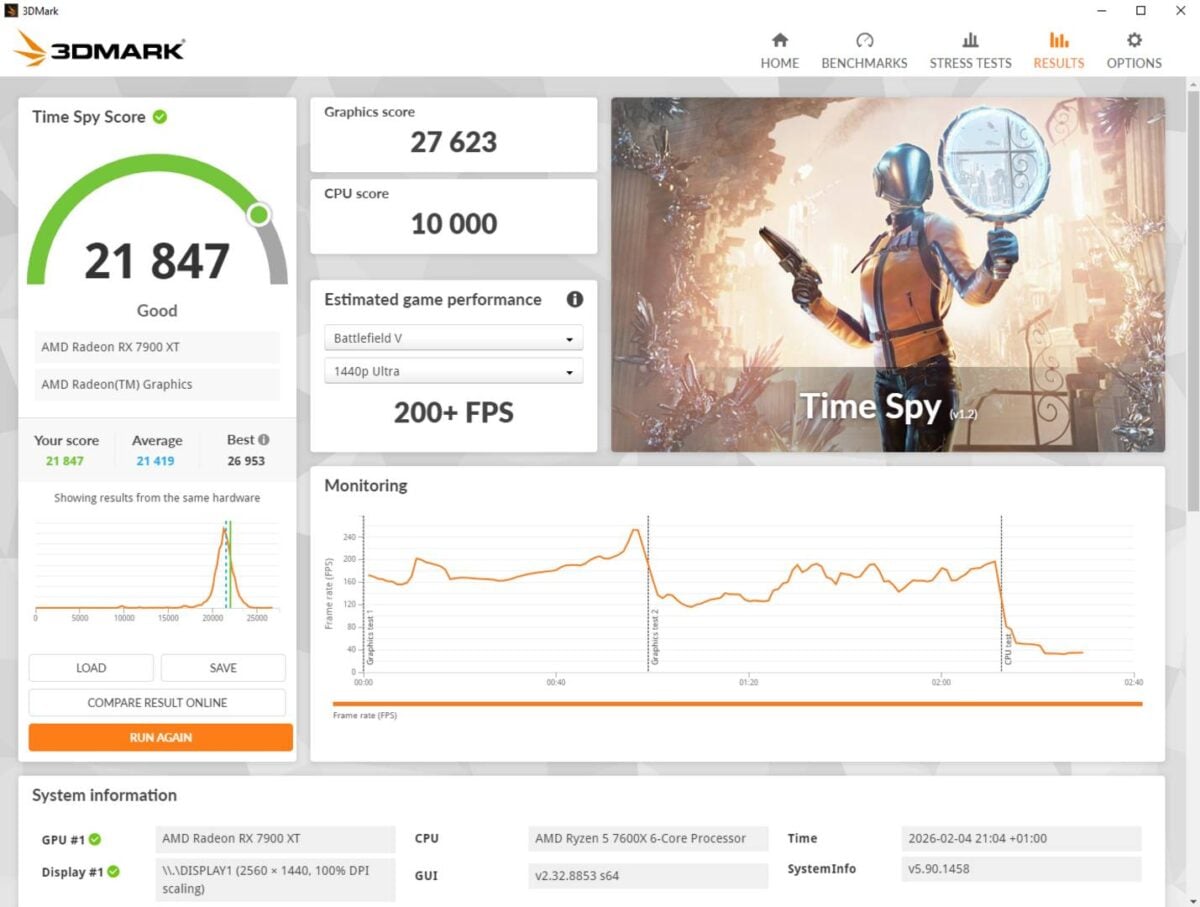
Like Cinebench, 3DMark gives you a final score that can be compared to reviews and online databases to ensure your GPU is operating optimally. This is a saviour for those who buy second-hand GPUs, as it clearly reveals the true performance of the card. At a glance, the app tells you if your GPU’s performance is abnormally low, indicating bad cooling, a system bottleneck, or worse, a hardware-level defect. Speaking of defects, 3DMark can reveal minute problems with the GPU or memory chips, appearing as visual artefacts during the test run. Don’t leave home without it!
CapFrameX
Open-Source/Community‑created and maintained. Download Link (13.6MB).
CapFrameX is a performance-monitoring tool for PC gamers that analyses and overlays the current render pipeline statistics. This tool can display many real-time system information metrics on top of your games, including frames per second (fps), frame time, and latency. Combined, these metrics give you a robust idea about the performance and smoothness of your game, revealing even the tiniest stutters and frame drops.
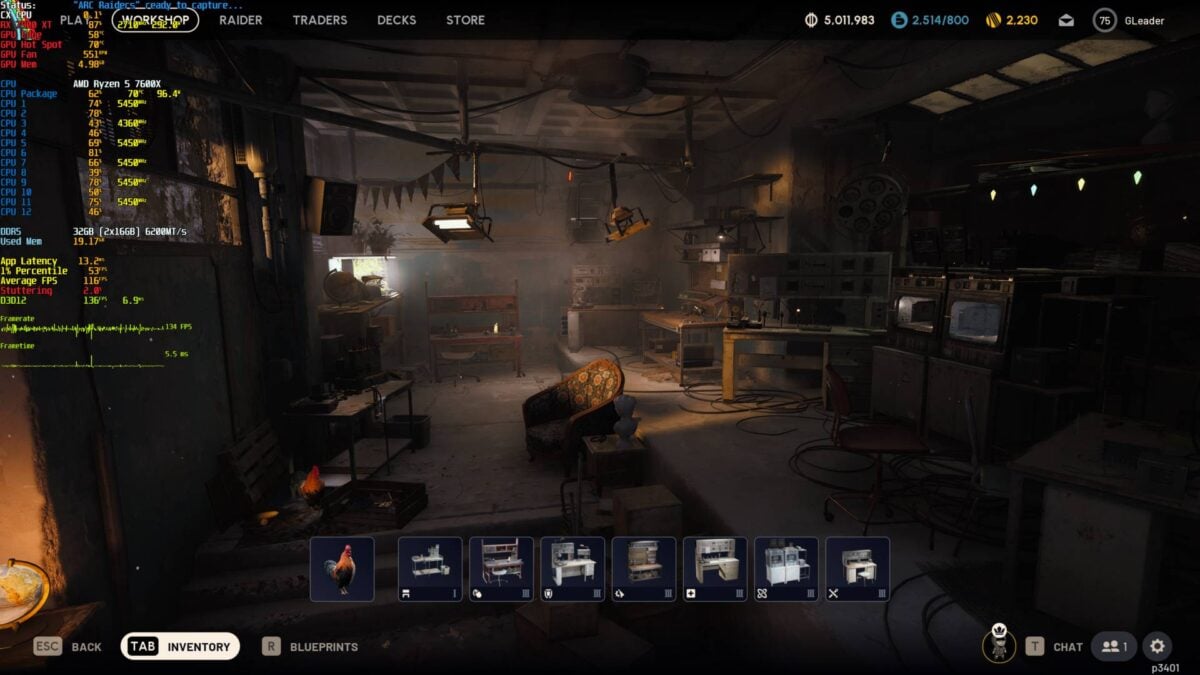
CapFrameX is a prized app by gamers as it shows the effect of graphics-settings changes on the spot, making performance optimisation easier than ever. It can also act as a benchmarking tool via its logging feature, allowing you to measure and compare any game, whether it has a built-in test or not. Its ability to display system statistics like VRAM and CPU usage makes it great for uncovering system limitations that hinder game performance, such as insufficient VRAM or thermal throttling. In other words, it’s a mandatory kit if you care about an optimal gaming experience.
All these apps can be run simultaneously or one by one, depending on how many system aspects you are monitoring. However, since some have overlapping features, I recommend only launching one or two at a time to avoid any unforeseen conflicts. If your PC passes each test with flying colours, you can be pretty certain you have a well-oiled machine.
I’d recommend running your favourite benchmarks the moment you change a piece of hardware or buy a new PC, saving the results, and then periodically run them again, comparing how closely the results resemble each other. Any significant drop-offs may indicate an issue, which can be further diagnosed by using more of the apps listed above. Happy benchmarking!