Intel Core Ultra 200S Plus CPUs provide great performance and value out of the box, but Core 200S Boost has the potential to push these chips further through a single-click tweaking tool. Keen to explore the feature’s potential on Intel’s latest CPUs, I’ve put it to the test to see if it has a significant effect on performance.
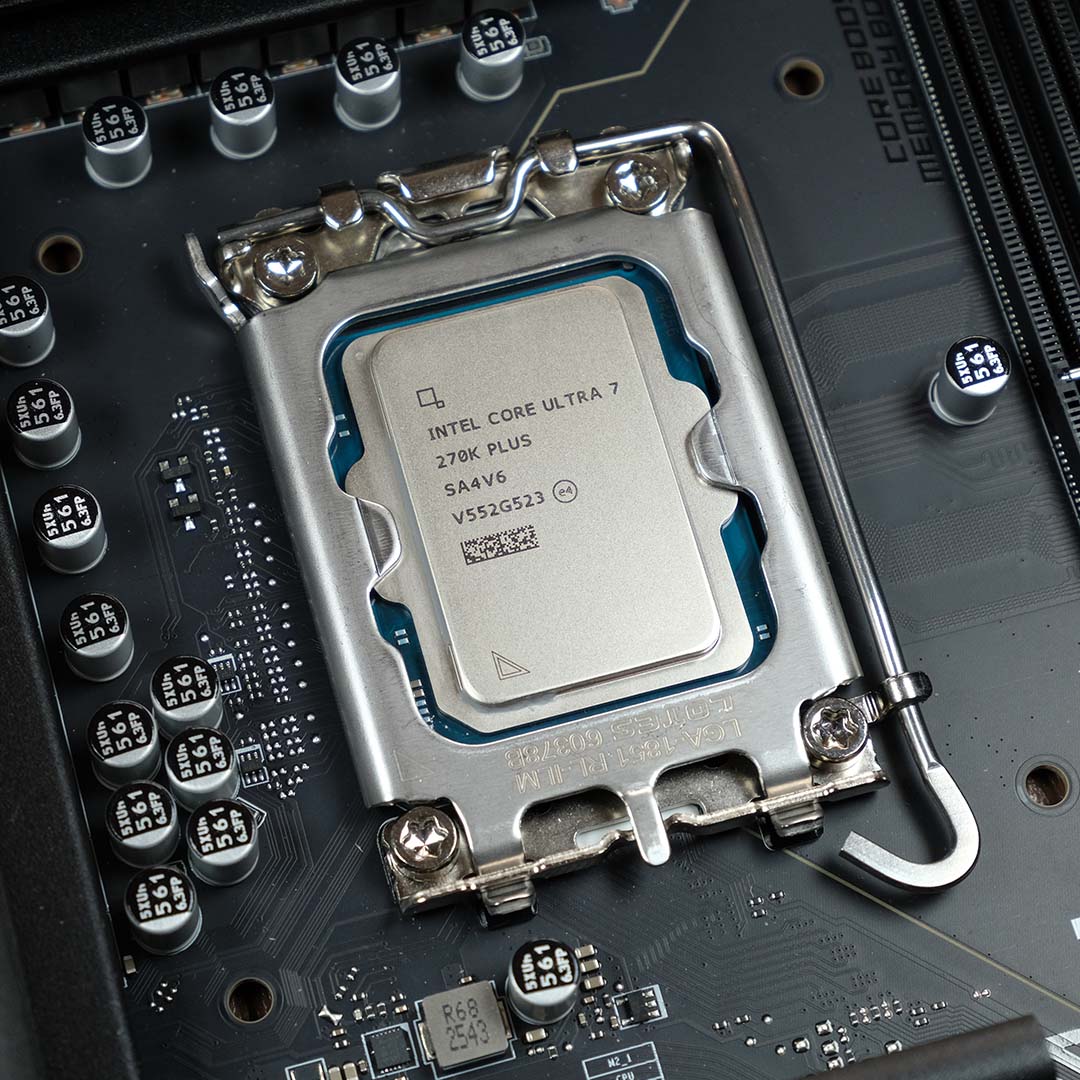
As I established in my Core Ultra 7 270K Plus review, this is the fastest chip on Intel’s LGA1851 platform. As such, it will be my CPU of choice in analysing the effects of Core 200S Boost, with the hope that this feature pushes performance to new heights.
What is Core 200S Boost?
Core 200S Boost is a one-click overclocking profile for Core Ultra 200S and Core Ultra 200S Plus processors with an unlocked multiplier (KF or K models). Rather than simply raising core frequencies, though, the feature bumps other variables to boost performance across the board.
Enabling Core 200S Boost on a Z890 motherboard will increase processor die-to-die (D2D) interconnect operating speeds, for example, with the Next Generation Uncore (NGU) and Integrated Memory Controller (IMC) also receiving a boost. The overclocking profile also brings support for up to 8,000MT/s DDR5 memory speeds, providing XMP profiles do not require more than 1.4V to run.
Here’s a table breaking down the changes that Core 200S Boost makes, alongside Core Ultra 200S and Core Ultra 200S Plus base specifications for context.
| Core Ultra 200S | Core Ultra 200S Plus | Core 200S Boost | |
|---|---|---|---|
| D2D | 2.6GHz | 3.0GHz | ≤3.2GHz |
| IMC | 2.1GHz | 3.0GHz | ≤3.2GHz |
| NGU | 6,400MT/s | 7,200MT/s | ≤8,000MT/s |
In theory, Core 200S Boost brings a transformative uplift in several respects for now-discontinued (bar the 285K) Core Ultra 200S processors. Meanwhile, Core Ultra 200S Plus CPUs already offer much of what this feature provides out of the box. Still, any uplifts, even minor 200MHz increases, are welcome.
Importantly, enabling Core 200S Boost doesn’t invalidate your CPU’s three-year limited warranty. Unlike traditional overclocking, this is much easier and comes with little risk. That’s the pitch, anyway, but let’s see how the feature holds up in reality.
Test methodology
Many of the components I’m using to test Core 200S Boost are those you’ll find in my initial Core Ultra 270K Plus review, specifically the same motherboard, graphics card, and memory. These are the key ingredients for getting the most out of the overclocking profile.
I’m subbing in the Arctic Xtender VG White to house my test build, with a 1TB Samsung 9100 Pro on storage duties and a 1,300W be quiet! Dark Power Pro 13 supplying all the watts I’ll need. While I would have happily used the prior setup, other projects I’m working on made such an approach too logistically difficult.
Core 200S Boost test PC
Club386 carefully chooses each component in a test bench to best suit the review at hand. When you view our benchmarks, you’re not just getting an opinion, but the results of rigorous testing carried out using hardware we trust.
Shop Club386 test platform components:
CPU: Intel Core Ultra 7 270K Plus
Cooler: Arctic Liquid Freezer III Pro 360
Motherboard: MSI MAG Z890 Tomahawk WiFi II
GPU: Nvidia GeForce RTX 5090 Founders Edition
Memory: 32GB DDR5-7200 G.Skill Trident Z5 RGB
Storage: 1TB Samsung 9100 Pro NVMe SSD
PSU: 1,300W be quiet! Dark Power Pro 13
Chassis: Arctic Xtender VG White
I’ll be comparing performance on Core 200S Boost to XMP, rather than baseline specs. Through this, we’ll be able to glean how much of a difference the D2D and IMC overclocks make across applications and games. Note, however, that I’m using a 7,200MT/s kit, leaving some potential improvements on the table that only an 8,000MT DIMMs could provide.
Finally, I’ve captured all gaming benchmarks at FHD (1080p) resolution, using High graphics presets in games, and without upscaling where possible. I’ve also used Intel Binary Optimisation in applicable titles, bar Geekbench 6, and will detail differences where relevant.
Performance
This is usually where I’d go through each application and discuss individual performance differences, in this case between Core 200S Boost and XMP. However, my findings sadly give me little to discuss, as the feature provides negligible uplifts in most cases, so I’ve compiled them all into the tables below.
Apps
| XMP | Core 200S Boost | % Change | |
|---|---|---|---|
| 7-Zip Compression | 196,740MIPS | 195,113MIPS | -1% |
| Blender | 658 samples | 658 samples | +0% |
| Cinebench 2026 ST | 564pts | 588pts | +4% |
| Cinebench 2026 MT | 9,785pts | 10,001pts | +2% |
| Corona 10 | 14.05M | 14.03M | -0% |
| Geekbench 6 SC | 3,259pts | 3,269pts | +0% |
| Geekbench 6 MC | 23,255pts | 23,272pts | +0% |
| PugetBench Photoshop | 11,160 | 11,233 | +1% |
| PugetBench Premiere Pro | 181,834pts | 183,009pts | +1% |
Cinebench 2026 is the largest benefactor of Core 200S Boost in our suite, with single-threaded scores increasing by a decent 4% from XMP. Multi-threaded performance also rises thanks to the feature, pushing beyond the five-figure mark, but this only translates into a 2% boost.
Meanwhile, all other creative and general applications see practically zero difference, to the point where any performance gains or depreciation falls into margin of error territory.
Gaming
| XMP | Core 200S Boost | Change | |
|---|---|---|---|
| Civilization VI | 22.72s | 22.65s | -0% |
| Cyberpunk 2077 | 180 / 220fps | 177 / 219fps | -2% / -0% |
| F1 25 | 95 / 273fps | 96 / 277fps | +1% / +1% |
| Final Fantasy XIV: Dawntrail | 90 / 267fps | 93 / 268fps | +3% / +0% |
| Rainbow Six Siege | 371 / 425fps | 373 / 423fps | +1% / -0% |
| Total War: Warhammer III | 124 / 170fps | 122 / 168fps | -2% / -1% |
Core 200S Boost similarly does little to boost gaming performance. Final Fantasy XIV: Dawntrail enjoys a 3% uplift in minimum frame rate, but we’re only talking about a difference of 3fps. Removing Binary Optimisation from the equation, both Core 200S Boost and XMP deliver identical frame rates.
Cyberpunk 2077 is the only other game in our suite that has a Binary Optimisation profile, with a -2% / 0% change in frame rates across XMP and Core 200S Boost reflected in the table above. Turn off the profile, and the former option emerges the faster with a 1% advantage in minimum frame rate.
Vitals
| XMP | Core 200S Boost | Change | |
|---|---|---|---|
| Temperature (Delta T) | 63°C | 62°C | -2% |
| Power consumption | 98 / 361W | 100 / 365W | +2% / +1% |
| Efficiency rating | 27.1 | 27.4 | +1% |
Given that Core 200S Boost doesn’t affect TDP, it comes as no surprise that there’s little difference in power consumption and temperature relative to XMP. We’re talking a blink and you’ll miss it change of 1°C and 2-4W at most. Bear in mind that our temperature figures are the Delta T, rather than the raw CPU temp, where we subtract the ambient room temperature to ensure consistency across our results.
Core 200S Boost does improve the efficiency rating of our Core Ultra 270K Plus, by virtue of providing a higher Cinebench 2026 multi-threaded score. However, a 1% gain is hardly anything to write home about.
Conclusion
The launch of Core Ultra 200S Plus processors has largely removed the need to use Core 200S Boost, as 200MHz increases in D2D and NGU frequencies do little to push performance. That said, those with RAM kits that run above 7,200MT/s will still find some value in the feature.
I’m naturally disappointed that Core 200S Boost can’t push my Core Ultra 7 270K Plus further in applications or games. However, I’m confident there’s still headroom to exploit on this CPU, and I’m now all the more curious to see how traditional methods of overclocking can push the chip. That’s not forgetting undervolting potential too.
Stay tuned for further analysis on Core Ultra 200S Plus overclocking potential. In the meantime, check out my Core Ultra 5 250K Plus review as well as our picks for the best CPUs on the market from both Intel and AMD.