

As dyed-in-the-wool PC enthusiasts we are always tinkering with our systems with a view of extracting maximum performance. Changing your CPU, memory, graphics card and storage can make a world of difference to real-world feel, but quantifying improvement is the domain of tried-and-trusted benchmarks. And boy, do we know benchmarks.
Shiny, new products claim to offer generational improvement over their predecessors, and buying decisions are often based on lofty claims and impartial editorial from experts like us. Yet the first sensible step in evaluating whether there is a need to upgrade a particular component is in fully understanding the capabilities of your desktop or laptop computer, identifying weaknesses and areas rife for advancement.
Good system benchmarks are easy to run, repeatable, and bear resemblance to real-world usage. Identifying those which best fit into this description is no easy task as there are thousands to choose from.
At Club386, we believe the following five benchmarks provide an accurate assessment of a system’s performance credentials, and whether you’re new to DIY builds or seeking a noteworthy upgrade, this guide serves as a handy how-to benchmark manual you can reference on any occasion.
CPU Performance: Cinebench R23
Download: maxon.net | Installation required: No | Time to bench: ~10mins
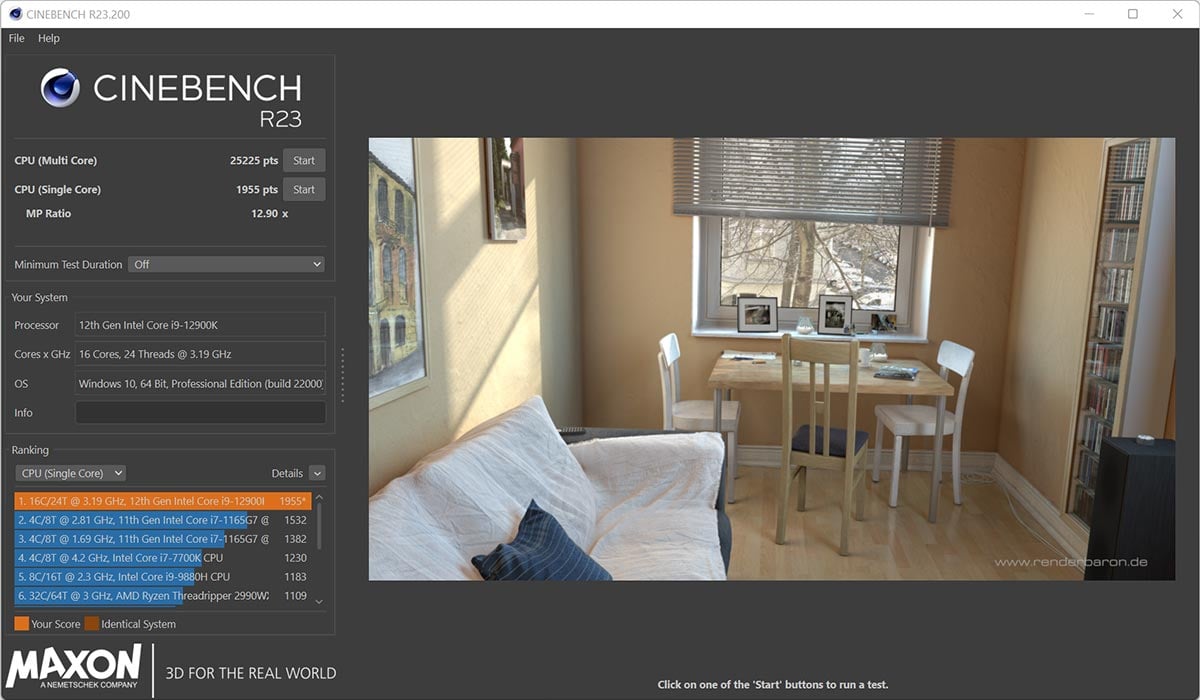
Used by hardware manufacturers and review websites for well over a decade, Cinebench provides an accurate means of evaluating how well your system runs the hugely popular Cinema 4D computer modelling, simulation and rendering software.
Able to stress every CPU core-and-thread to the limit, this test ably recreates a heavy multi-tasking environment. When Intel and AMD say a particular processor is great for content creation workflows, or a system integrator reckons their machine is primed for multimedia professionals, Cinebench R23 separates fact from hyperbole.
Running Cinebench R23 could not be easier, and it works on laptops, desktops, and even Apple computers. Simply download from the above link, extract the contents of the zip file and launch the standalone Cinebench application.
There’s no installation required; run either the single- or multi-threaded test and the rendering engine does its thing by completing the benchmark as quickly as your hardware allows. We recommended setting a minimum test duration of at least 10 minutes (the option is made available by selecting File->Advanced Benchmark) to allow for any throttling discrepancies.
Results are presented upon completion as a score, with higher being better. The score is linear insofar as a system achieving, for example, 10,000 is exactly twice as fast as a system scoring 5,000. A handy little comparison box offers insight into how your system compares against a number of presets, though Cinebench’s ubiquity means it is easy to frame present performance against modern processors and systems. Club386 uses Cinebench R23 in all CPU and system reviews. Reckon your PC is fast? Can it match the 25,225 score posted by an Intel Core i9-12900K? Load up Cinebench and find out.
Storage Performance: CrystalDiskMark
Download: crystalmark.info | Installation required: No | Time to bench: ~5mins
Shifting gears to storage, upgrading the system drive has a huge impact on real-world performance and responsiveness. Anyone still stuck on traditional mechanical drives has our sympathies.
Practically all consumer PC storage is now realised in solid-state drives, or SSDs. With no moving parts and capacities increasing to over 4TB for a single drive, there is absolutely no reason to be without one. But not all are created equal, and manufacturers are continually pushing the performance envelope.
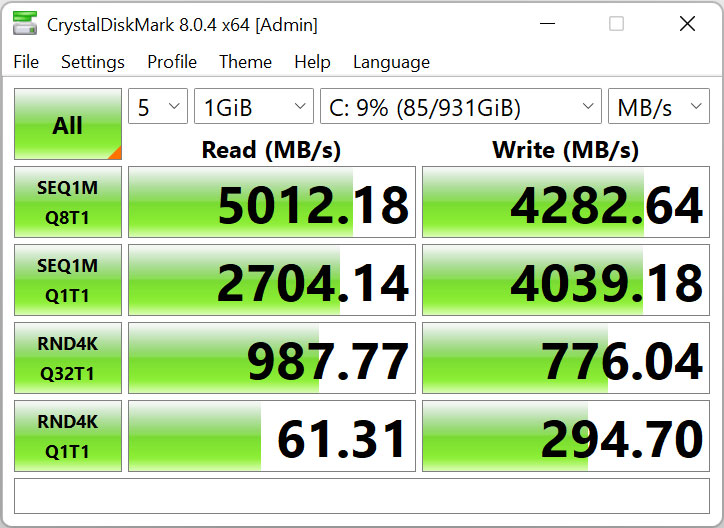
Entry-level SSDs can transfer data at up to 3GB/s, premium drives increase that to around 5GB/s, whilst the very latest enthusiast models tout 7GB/s maximum throughput. There are other facets to storage performance, too, such as IOPS and performance when dealing with very small files, and this is exactly why an easy-to-understand benchmark is useful.
CrystalDiskMark is another helpful benchmark requiring no installation. Simply download the latest version from the above link, extract the contents and run DiskMark64.exe. Default settings tick the right boxes for most users, and clicking one button – ‘All’ – starts off a chain of automated benchmarks that thoroughly analyse drive performance. Used in Club386 storage and system reviews, CrystalDiskMark shows how the very latest SSDs can potentially turbocharge system responsiveness.
System Performance: PCMark 10 (Demo)
Download: Steam Store | Installation required: Yes | Time to bench: ~30mins
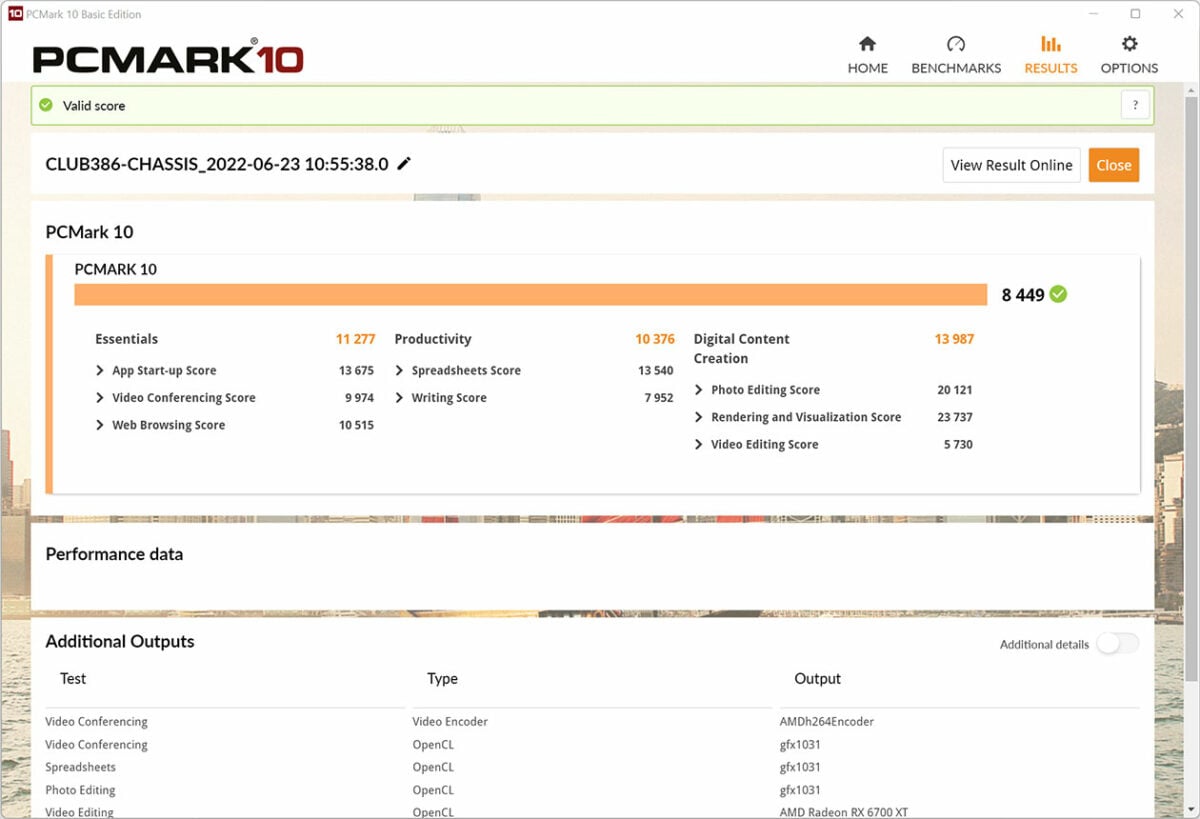
Some benchmarks claim to test one particular facet of the system, others claim to be experts in another field. Very few benchmarks attempt to tie overall system performance into one understandable metric. PCMark 10 is that benchmark, serving as a one-stop shop for gleaning how your system fares when running everyday tasks such as productivity through to digital content creation.
Evaluating the system as a whole, rather than a sum of its parts, is instructive insofar as any major changes to hardware have a direct impact upon the composite score. A better system scores higher than a mediocre one.
Unlike totally synthetic benchmarks that have little real-world applicability, PCMark 10’s use of application traces, captured from popular software used by millions of users, simulates app start-up times, web browsing through Firefox and Chromium, as well as video conferencing using Windows Media Foundation for video playback and encoding. A handy tool to have in your testing arsenal.
PCMark 10 installation is a little more involved. With no standalone package available, the free demo is obtained through the Steam Store. There are various in-app purchases available, though the base test is free with no purchase necessary.
Another one-click benchmark, PCMark takes around 30 minutes to run, leading to a score that’s readily comparable against any other system. Scores of below 5,000 marks indicate an entry-level system, those residing between 5,000-7,500 marks offer a premium experience, whilst any machine posting in excess of 7,500 is a bit of a beast.
Graphics Performance: 3DMark Time Spy (Demo)
Download: Steam Store | Installation required: Yes | Time to bench: ~10mins
A lot of industry attention is focussed on the graphics card market. Rightfully so, as the PC remains a premier destination for high-quality gaming whose visual fidelity exceeds that of even modern consoles such as the PlayStation 5 and Xbox Series X.
With myriad games on the market, understanding exactly how your graphics card performs is a laborious task of testing every game you play. Club386 does that work for you in GPU reviews, but even so, you need access to each game and the exact settings to replicate our findings for your system.
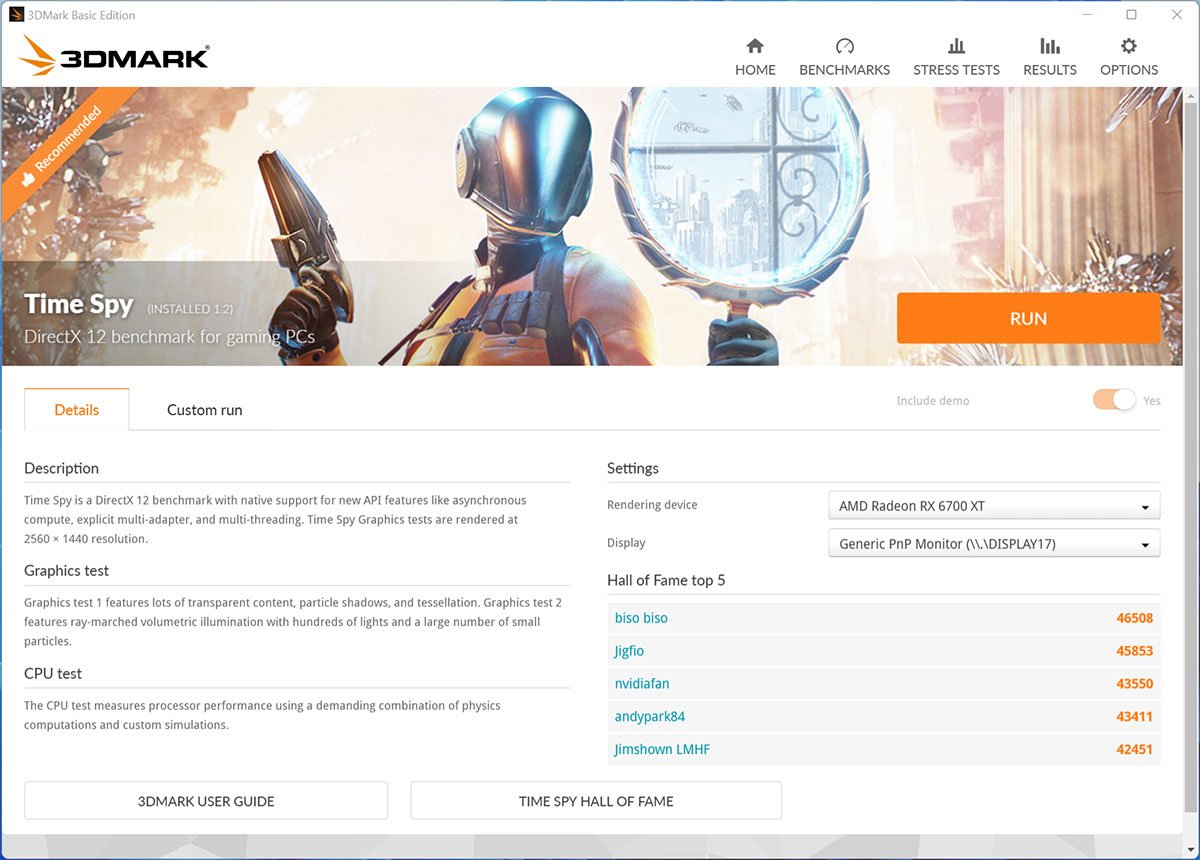
This is where 3DMark Time Spy comes in. Using the latest DX12 components which enable graphics cards to offer rich, immersive visuals, this benchmark runs through a number of gaming scenarios and builds a composite score that’s repeatable run after run.
More powerful graphics cards score higher because they have more intrinsic muscle to play with, but just as with the real world, having a more potent CPU is also beneficial and has a material impact upon the final score.
In keeping with PCMark, 3DMark offers no standalone package and must be downloaded through the Steam Store. Be aware of limitations to the free demo – you won’t be able to customise the benchmark or run specific resolutions – yet 3DMark Time Spy can be used as a rough rule of thumb in deciding which image resolution is best suited to your system.
In our opinion, computers scoring below 10,000 marks in the default test are primed for playing games at a FHD (1920×1080) resolution, those offering up 10,000-15,000 marks are great for QHD (2560×1440) gaming at decent framerates, whilst powerful machines routinely exceeding 15,000 marks ought to make a good fist of gaming at UHD (3840×2160) with all the image-quality settings turned up to maximum.
Gaming Performance: Final Fantasy XIV: Endwalker
Download: finalfantasyxiv.com | Installation required: No | Time to bench: ~10mins
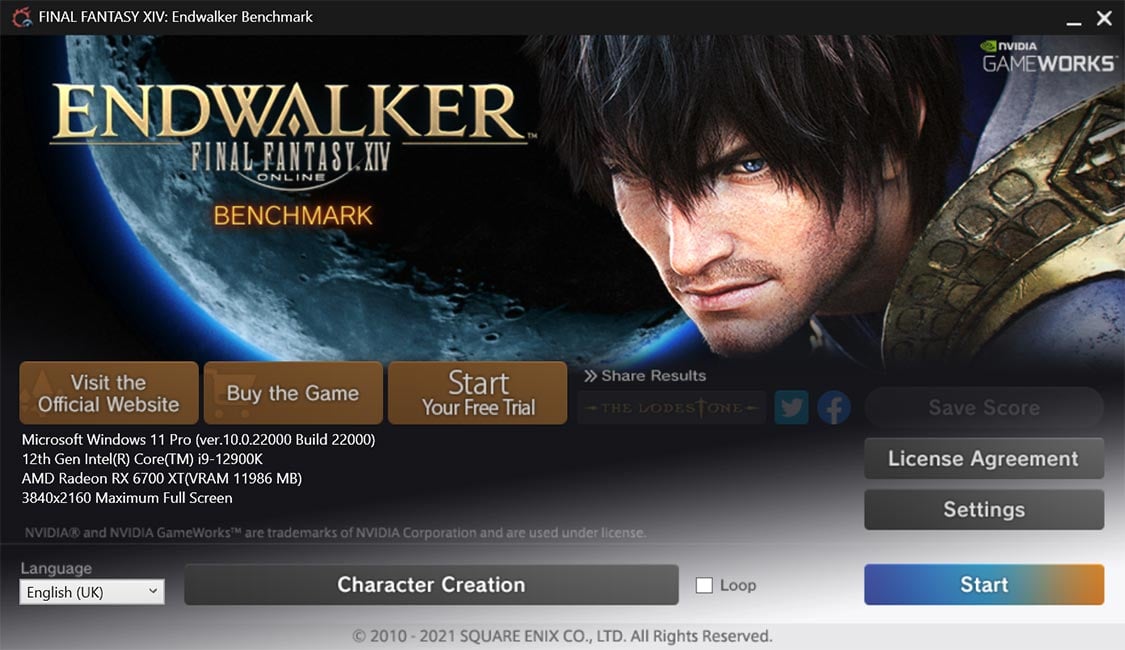
While 3DMark Time Spy is a fine benchmark for evaluating overall graphics performance, true gaming insight can also be gleaned by running a real game. There are, literally, thousands to choose from, but understanding this article is about easy-to-use benchmarks offering useful information, Final Fantasy XIV: Endwalker is hard to beat.
Being the fourth expansion pack to Final Fantasy XIV, a wildly popular massive multiplayer online role-playing game, released to critical acclaim in December 2021, it serves as perfect candidate in evaluating real-world performance.
It just so happens Final Fantasy XIV: Endwalker has a useful standalone benchmark which runs through a scripted sequence lasting several minutes and replicating the look, feel and performance of the full game. This 2.2GB download also offers the ability to toggle image-quality settings and resolutions, meaning it hits all the required straps of good benchmarking practise.
Based on settings, final results categorise system performance into one of several categories. High Performance (8,000 – 10,999) intimates a PC easily capable of running the game at higher resolutions, Standard performance (4,000 – 5,999) suggests the game ought to be kept to default settings, while Low Performance (1,000 – 1,999) reveals the game will experience considerable slowdown. As an added bonus, you can save your score as a text file, which reveals a more granular look at minimum and average framerate.
Computers lacking graphics firepower are in need for either an upgrade or reduction in image quality, and that’s what so great about this particular application: it’s easy to identify a solution for smooth gameplay.
Summary
There you have it. Five free benchmarks we wouldn’t be without. Each offers meaningful insight into how your present computer stacks when compared to newer hardware, and makes it easy to identify which components are in most need of an upgrade.
Yes, there are more complex and complete tests out there which focus more intently on various system attributes, but the five listed above are great introductory tools open to the masses.
What are you waiting for! Get busy downloading and see how your computer performs against the bevy of components and systems we have tested. After all, knowledge is power.