

The prices of PC graphics cards are in free fall. Deal upon deal unearths veritable bargains that positively demand you update that knackered old card for something new and shiny. If you have $300 / £300 to spend, how’s about a GeForce RTX 3060 Ti 8GB or, for a little more, Radeon RX 6750 XT 12GB?
Though hardware sites do a great job in distilling the performance advantages of upgrading to newer GPU hardware, the informed enthusiast remains rightfully keen on witnessing the upticks themselves. For this reason, myriad benchmarks exist, and we take a closer look at some of the more popular and free ones available today.
There are many ways to check if your old or newly-acquired hardware is delivering the right amount of performance. Benchmarks can serve as a sanity check, to verify if everything is OK, or provide insight into the potential gains from a GPU upgrade, which is important given the insane prices available across AMD, Intel and Nvidia hardware.
A small thing to keep in mind before comparing your scores online; results will vary depending on the chosen resolution and settings, so try to compare apples to apples by choosing the same settings as listed in the review you are looking at. Without any more fuss, here’s what you can use to measure the best graphics card performance.
3DMark
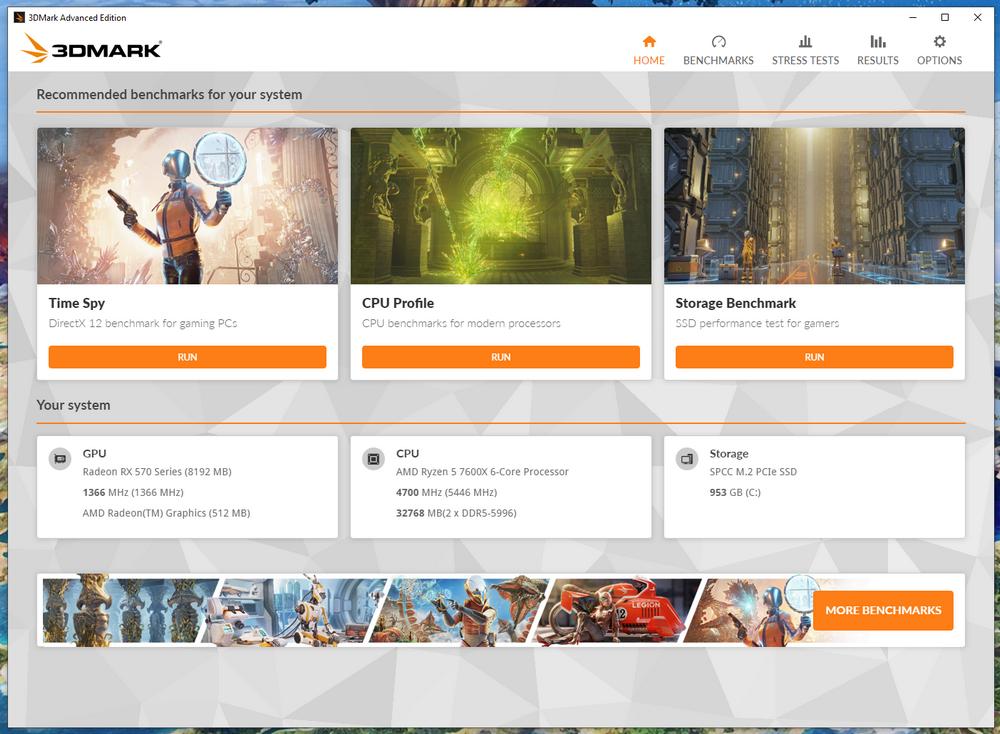
Developer: UL | Download: benchmarks.ul.com/3dmark
Representing the go-to benchmark for GPUs over many years, 3DMark is verging on mandatory software for comparing hardware performance. Offering three tests in its free version – Night Raid, Fire Strike, and Time Spy – there are literally tens of thousands of results present.
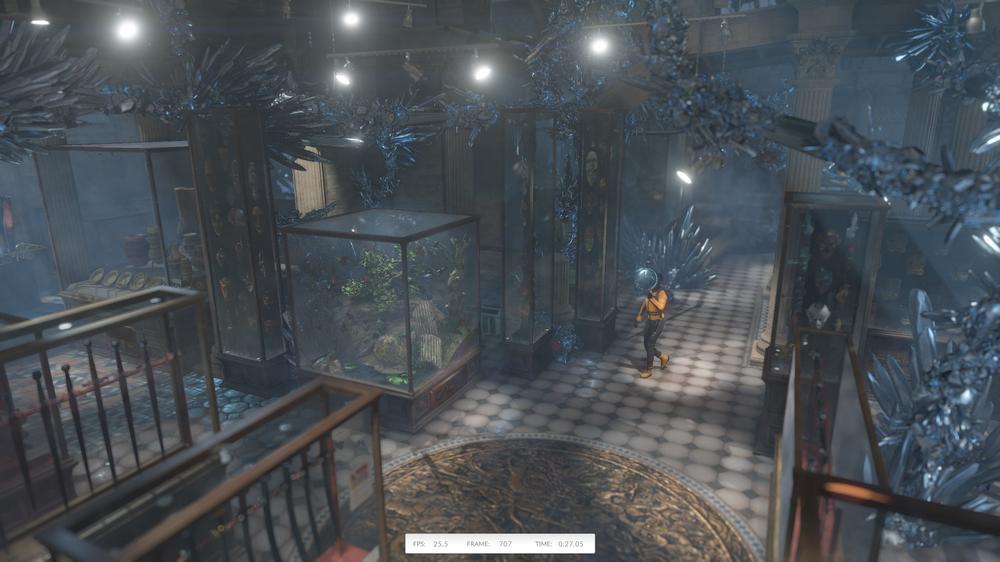
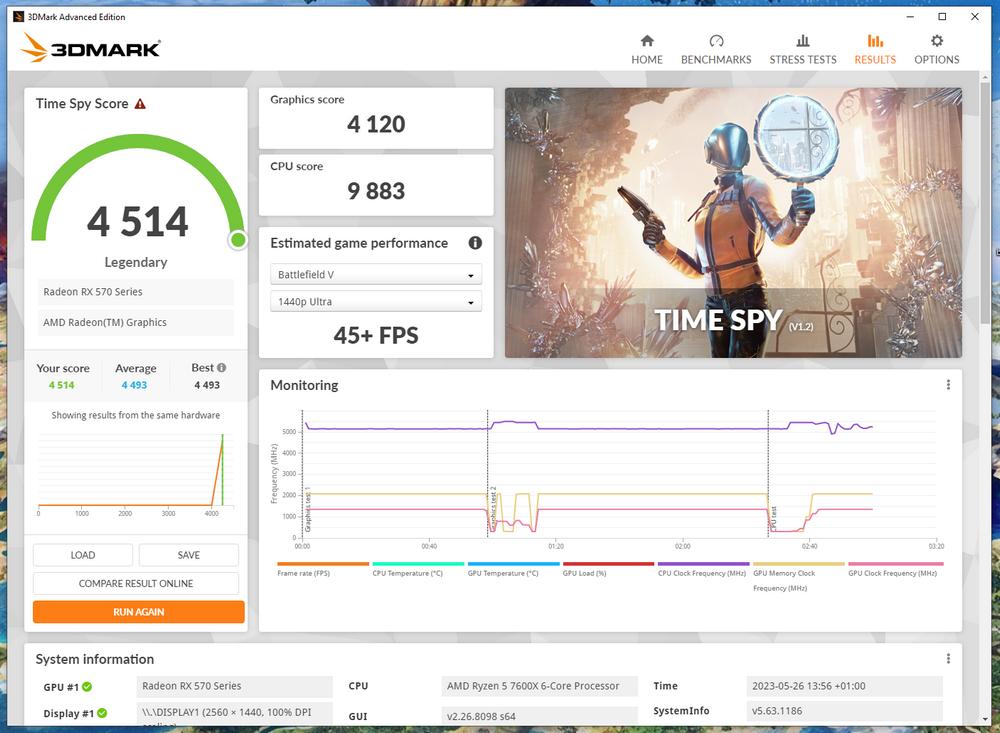
3DMark runs a set of graphics tests before spitting out a score that can be compared with online databases and reviews, making for an easy way to understand hardware capabilities. For example, running the Time Spy test on my personal AMD Radeon RX 570 results in a 4,120 graphics score, which is on the high side for an RX570. This happens due to me forcing lower tessellation levels inside Radeon drivers.
Comparing the score to UL’s database indicates my GPU is working correctly… and that I can get a six-fold uplift by upgrading to an RX 7900 XT. However, combing through results also shows I can save some cash by accepting a lower four-time increase and choosing the GeForce RTX 4070 instead.
Note that you can test both GPU-only performance, or GPU plus CPU, combined, for a more general view of the system.
Unigine
Developer: Unigine Company | Download: Heaven / Superposition
Unigine Heaven is a lightweight benchmark handy for a quick check. Do your games keep crashing for no apparent reason, or you feel like they are operating slower than usual? Give Unigine a run. Not only will it provide a number that can be referenced against, the benchmark is a good stability test. It’s extra-useful when overclocking, thanks to the fast loading and tendency to only crash drivers instead of the entire system with unstable OCs, in my personal experience.
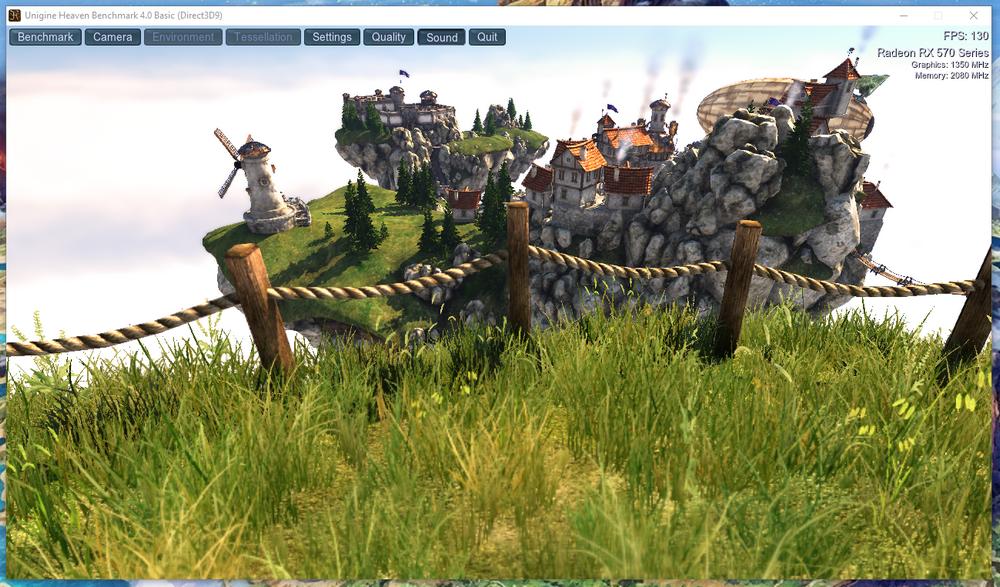
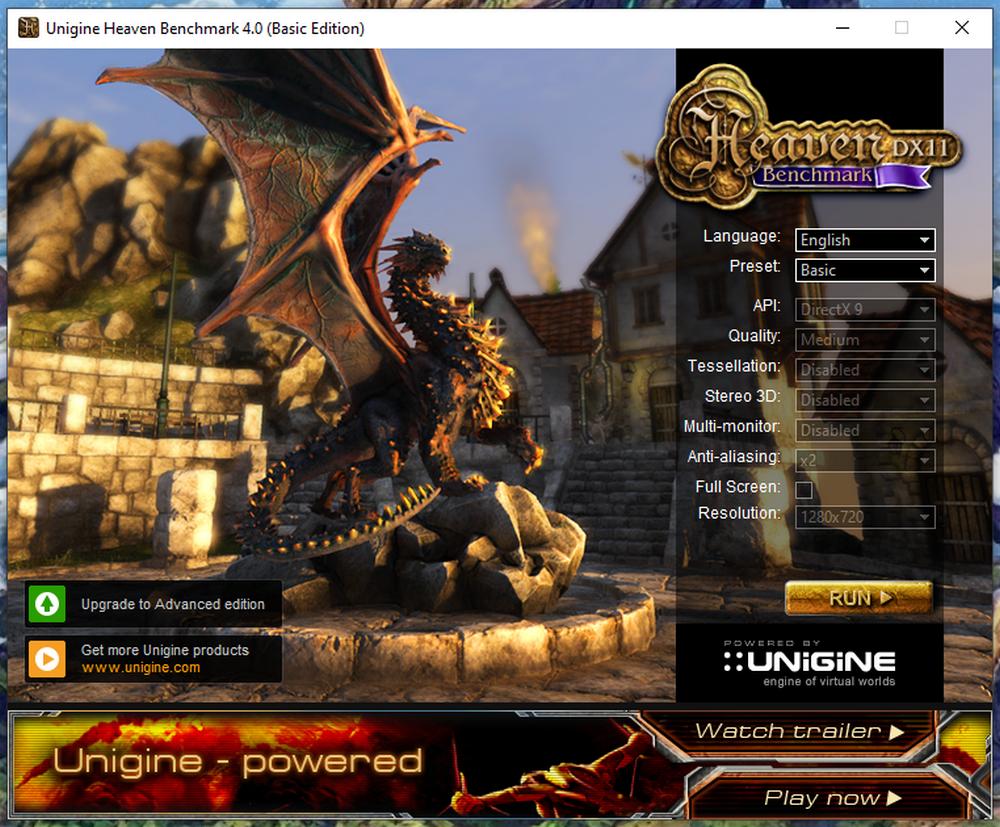
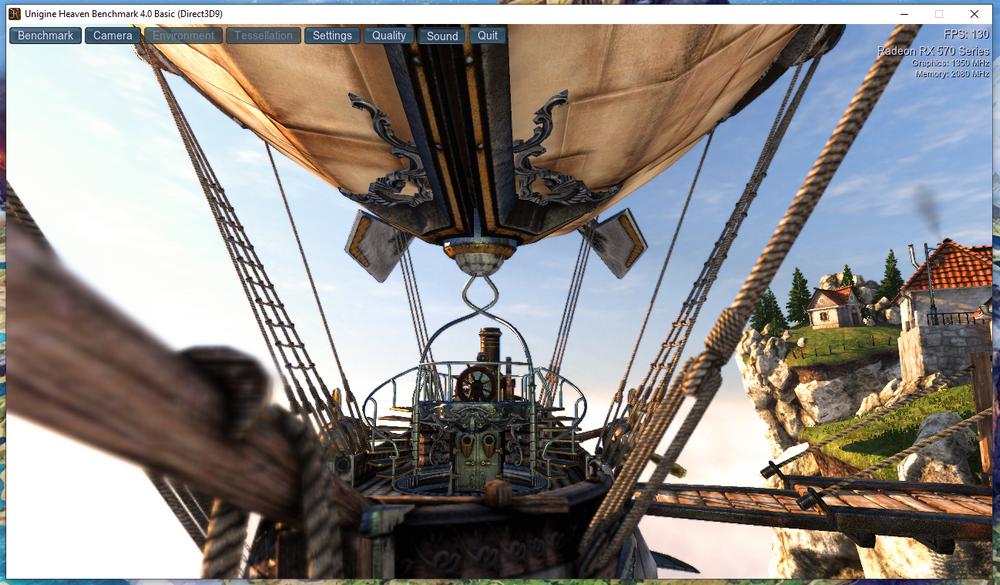
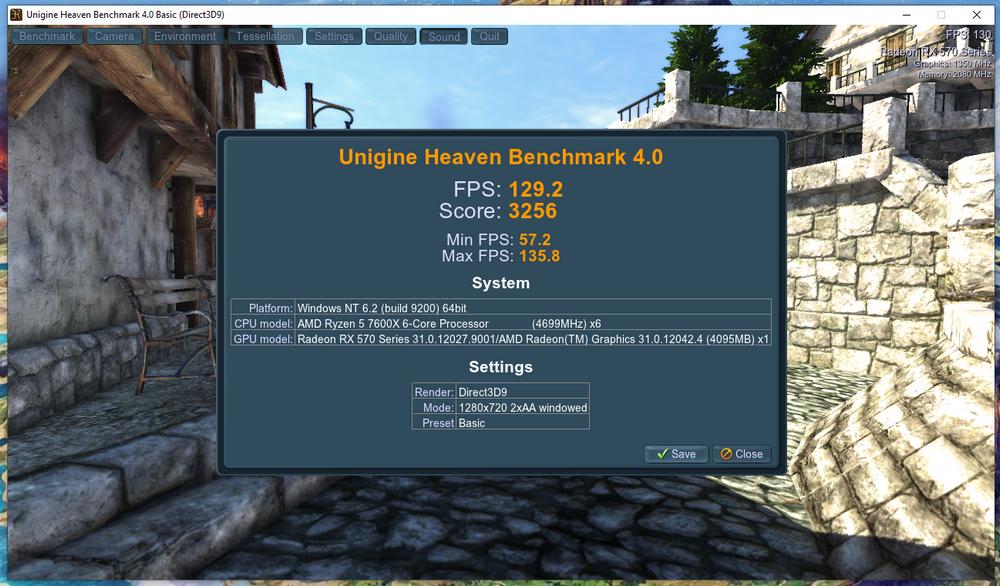
I mainly use Unigine when verifying my overclocking isn’t too high, since going overboard may result in lower performance than stock. The Heaven benchmark alone is enough to confirm stability for a +106MHz GPU and +330MHz memory frequency on the aforementioned Radeon RX 570. Providing readers with the inside track, this is done by first running the test at stock GPU specs, noting the score somewhere, and running the same test after OC. If you see a performance uplift, then you’re golden; if not, or if there’s a crash, then dial down the frequency a bit and rerun until stability is guaranteed.
As for comparing to other GPUs, Unigine, too, hosts a score leaderboard for the popular Superposition test variant. It’s a heavier and more modern benchmark that can also examine the VR capabilities of your hardware.
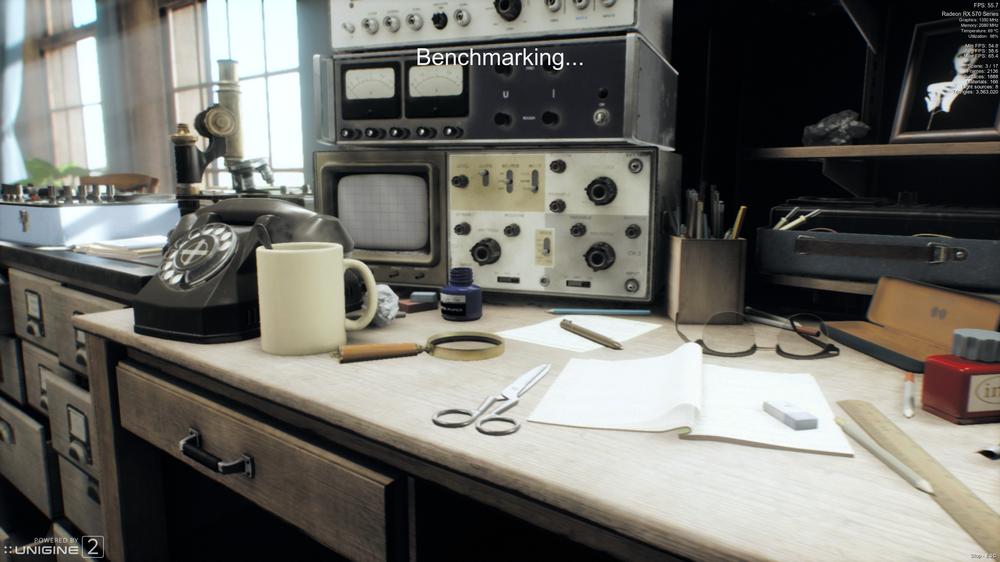
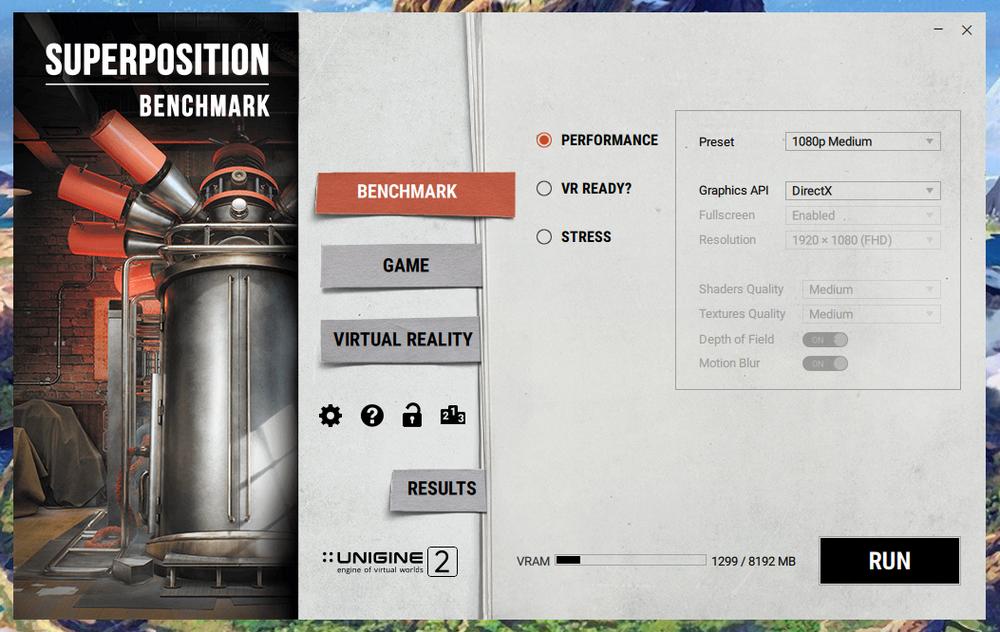
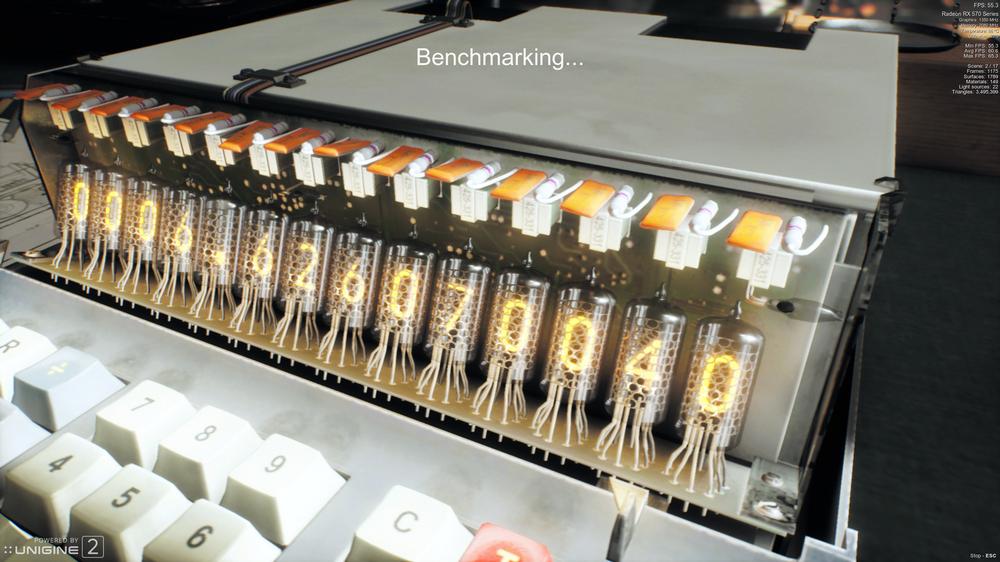
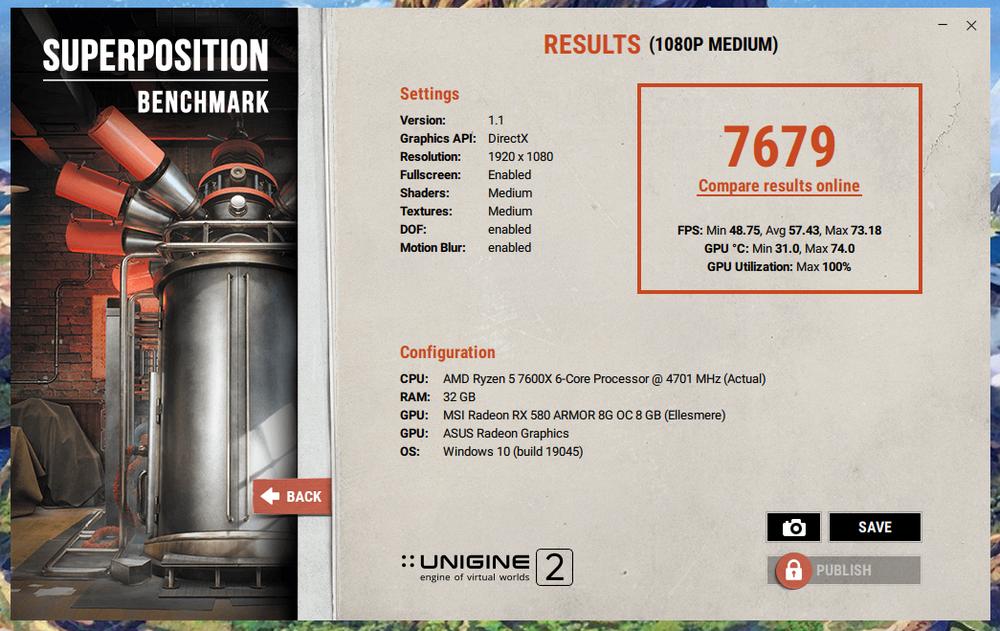
Testing my Radeon RX 570 on Superposition nets 7,679 points, which is also about four times slower than an RTX 4070, according to the database, thus indirectly confirming my 3DMark Time Spy results. In other words, it is always preferable to run at least two different benchmarks, each multiple times, to discard outliers. Just make sure to pick the right filter when comparing scores on the leaderboard.
To be clear, in real-world gaming scenarios, the RTX 4070 may not deliver four times the FPS numbers. For true and usable performance, check out our next pick.
CapFrameX
Developer: Mark Fangmeyer | Download: capframex.com
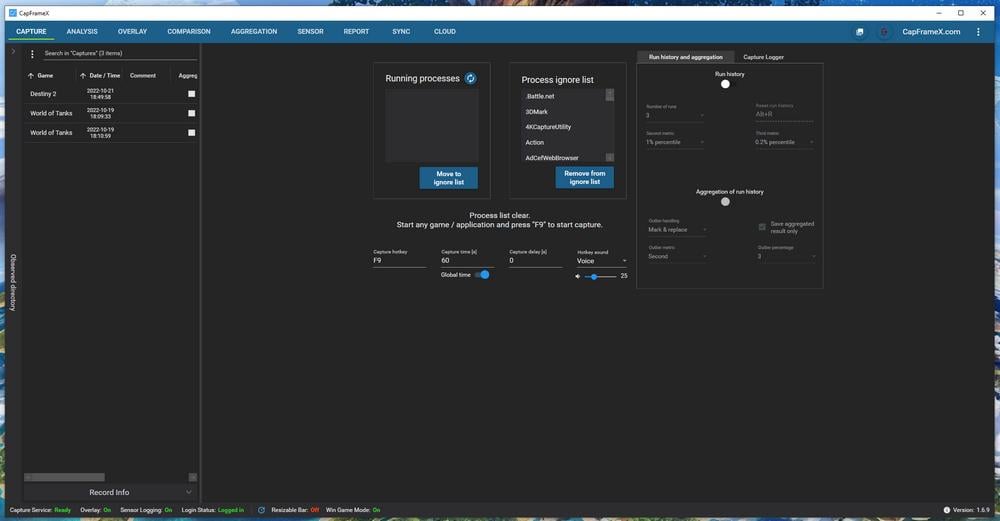
Arguably the most detailed of the bunch, CapFrameX isn’t a benchmark per se, but rather a frame-rate recorder that allows for data analysis later. Based on Intel’s PresentMon tool, it provides a straightforward method of obtaining those frame-time charts seen in GPU reviews. Well, now you too can indulge in them using this handy bit of kit.
To give you a quick idea regarding the frame-time graph – pictured below – lower ms is better. For example, 16ms equals 60FPS. A consistent graph, which is tighter and without many spiked excursions, is better.
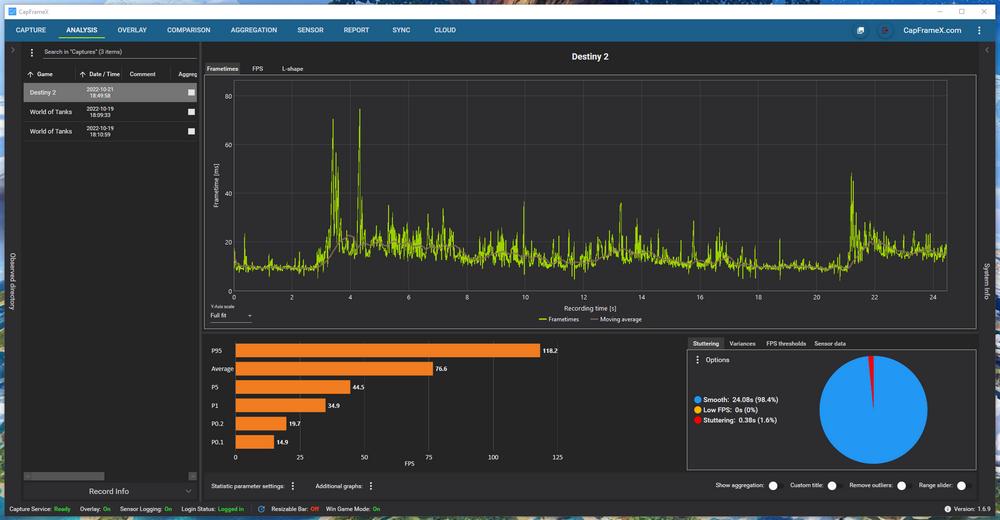
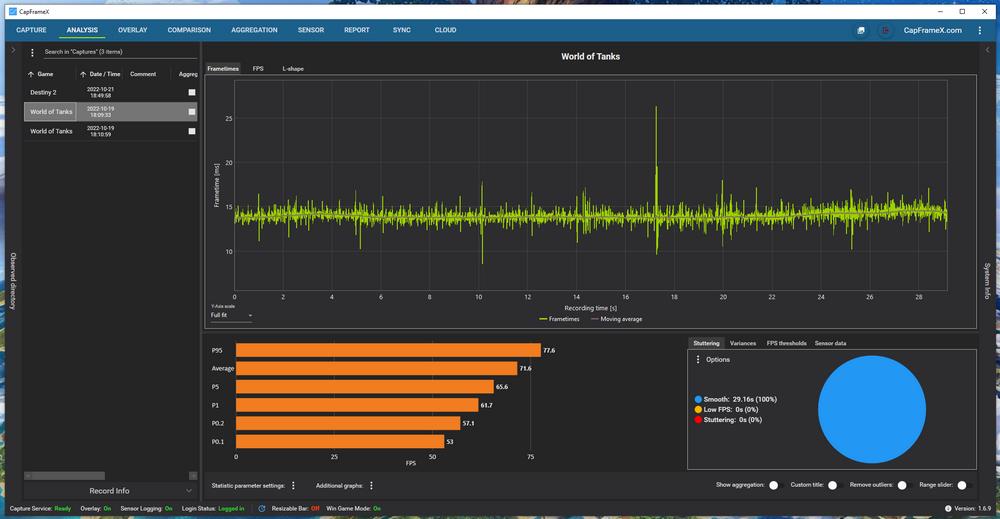
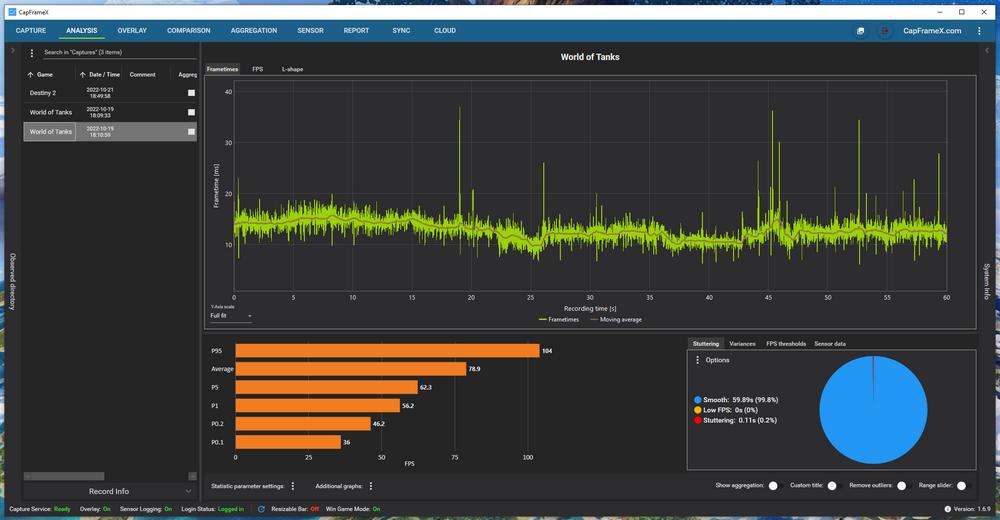
There’s nothing complicated about comparing results. Simply hop on your favourite review site – Club386, of course – and see if your average FPS numbers match those on the review. Keep in mind that the rest of the system – i.e. CPU, RAM, and even the OS – play a major role in the FPS you get, so results may vary.
The only downside to CapFrameX is the longer initial configuration if you care about customisation. The default settings, however, should do the trick for fast performance checking.
CapFrameX can also display an overlay on top of any game, except those with annoying anti-cheats that block it, showing live FPS and frame-time reads, which is handy when trying to find the best game settings.
Final Fantasy XIV: Endwalker
Developer: Square Enix | Download: finalfantasyxiv.com/benchmark
In the land of free graphics-measuring benchmarks that also have real-world applications, few fare better than Final Fantasy XIV: Endwalker. The benchmark is actually based on the popular, very well-received game launched on PC in December 2021.
This official benchmark software uses actual maps and playable characters to assign a score to your PC and rate its performance. A character creation tool is also included, allowing you to view a playable character as they will appear in-game. Neat, huh?
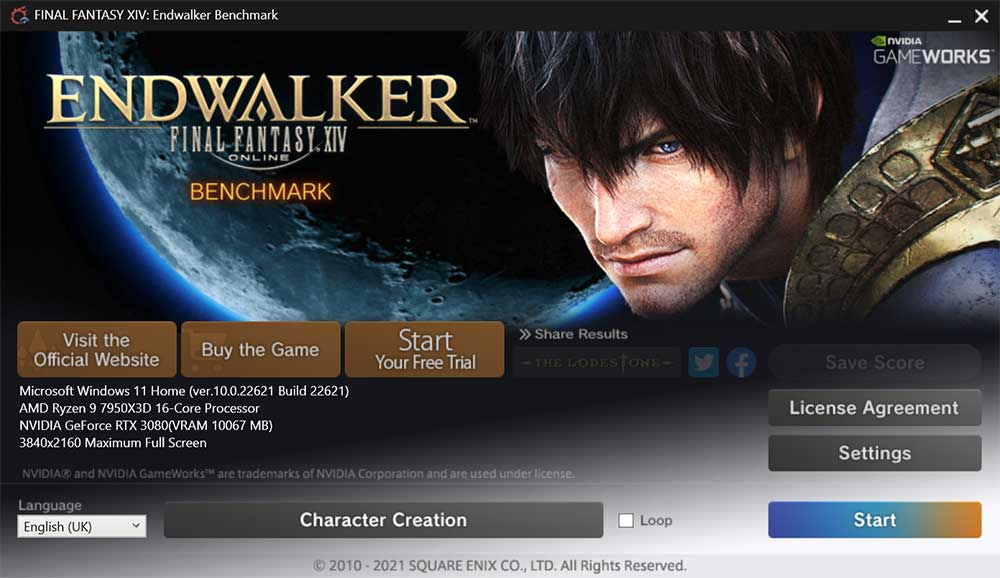
Offering high degrees of visual customisation, the benchmark runs through lengthy sequencies to arrive at metrics that include average and minimum framerates as well as, intriguingly, cumulative level-loading time where modern SSDs do far better than traditional spinning media. A gaming benchmark to run them all.
Used as a staple by Club386 for graphics reviews, comparing performance is extremely easy. The latest 15-GPU mainstream roundup, for example, shows a GeForce GTX 1060 obtaining 56FPS at QHD whilst a Radeon RX 6750 XT manages 138FPS. A great tool that’s both easy to use and informative at the same time.
FurMark
Developer: Geeks3D | Download: geeks3d.com/furmark
If you live in a hot climate or are too lazy to clean your graphics card… yet want to make sure the GPU doesn’t cook itself, FurMark is the chosen one. Able to push GPU temperature to the extreme, in some cases even too much, this light app runs a simple yet effective stress test bound to extract every bit of heat and power from your card.
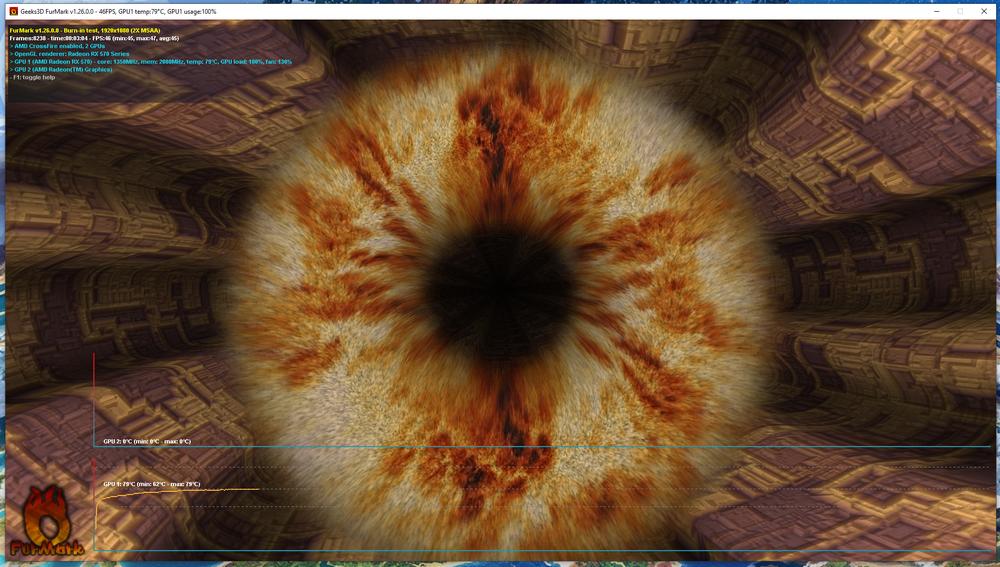
Driving my poor Radeon RX 570 through this GPU-melter pushes temperatures to 79°C with fans at full throttle. “That’s hot,” as Will Smith would say. Naturally, as we are talking about GPU performance comparisons, FurMark also features a benchmark section and an online leaderboard to compare results.
Finally, note that CapFrameX and Final Fantasy aside, all the above apps can also function as a stress test.
Power and Temperature
As for GPU power consumption and temperature, we recommend two handy tools: HWiNFO or HWMonitor. Great for complete system monitoring, including voltages, power consumption, temperatures and even frequencies, there’s no need to look elsewhere.
Before we close up, there are many free-to-download, popular games available. Using CapFrameX of Fraps as the frame-measurement engines, results can be compared to online reviews, allowing you to further check if graphics hardware is operating optimally. Just to name a few, there’s Destiny 2, World of Tanks, War Thunder, Counter-Strike: GO, Path of Exile, Apex Legends , Valorant, Call of Duty Warzone, and Fortnite, which has the benefit of also featuring ray tracing. More free games to test can be found in our 2022 F2P roundup.
What are you waiting for? Get benching.