

Intel has unveiled a new tool aimed at detecting CPU bottlenecks and given itself a good ol’ pat on the back with regards to improvements brought to Arc drivers following 30 consecutive updates.
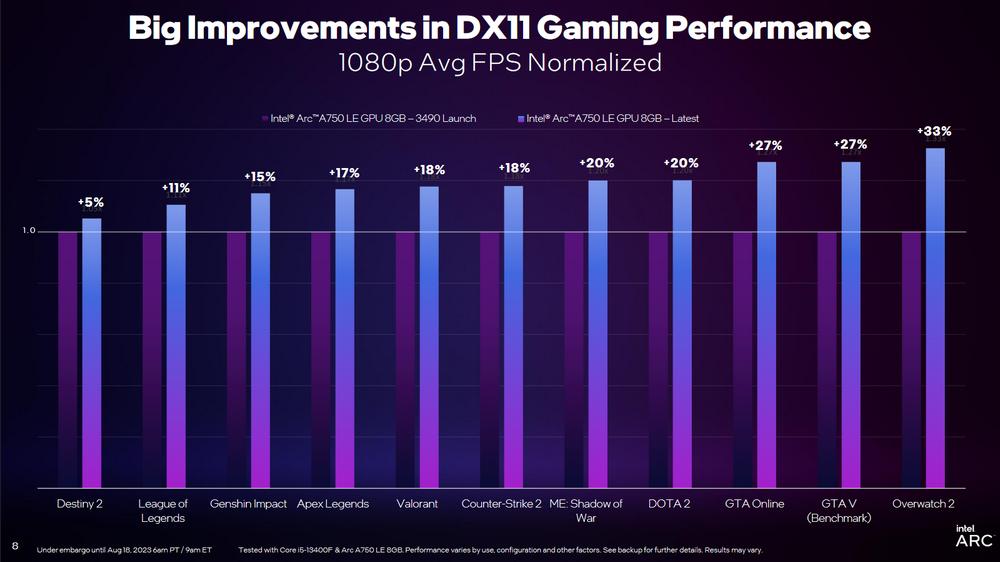
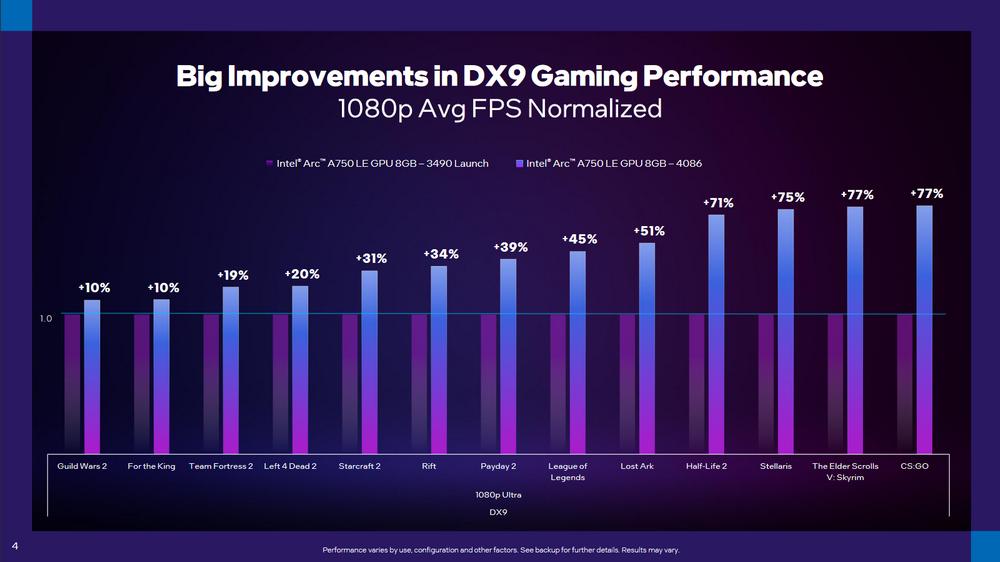
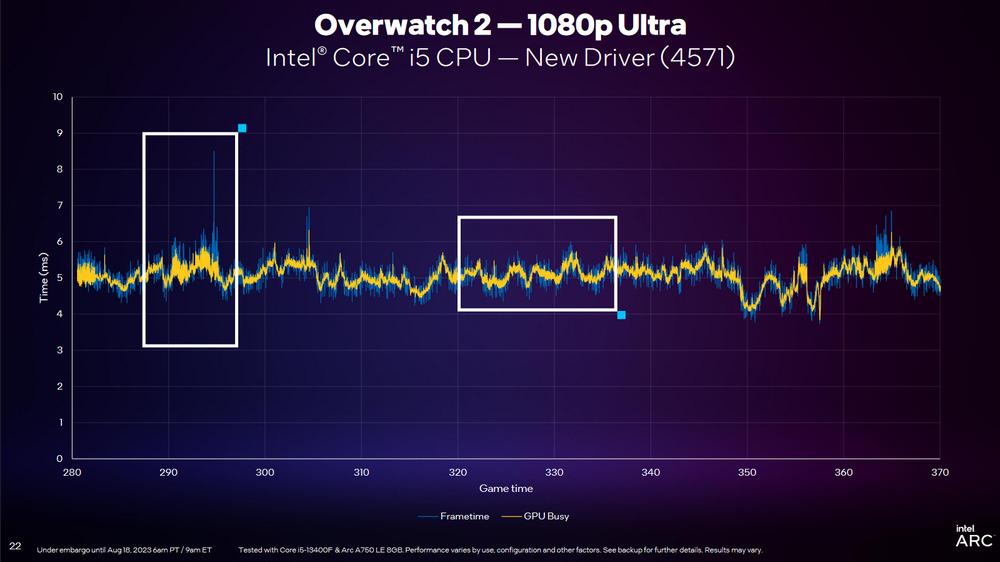
Compared to launch, Intel reckons Arc drivers are now 19 per cent faster and 20 per cent smoother on average in DirectX 11 games. Using a machine powered by a Core i5-13400F CPU plus Arc 750 LE 8GB GPU, Intel claims up to 77 per cent average frame rate improvements in DX9 games at 1080p over launch drivers, and up to 33 per cent in DX11 games at 1080p. 99th percentile is also improving quite a bit, reaching up to 45 per cent in Overwatch 2 for much smoother gameplay.
Club386 in-house testing highlighted Arc’s growing potential earlier this year, and Intel has indicated this is only the beginning as more titles will benefit from improved drivers, with higher uplifts seen in CPU-limited scenarios.
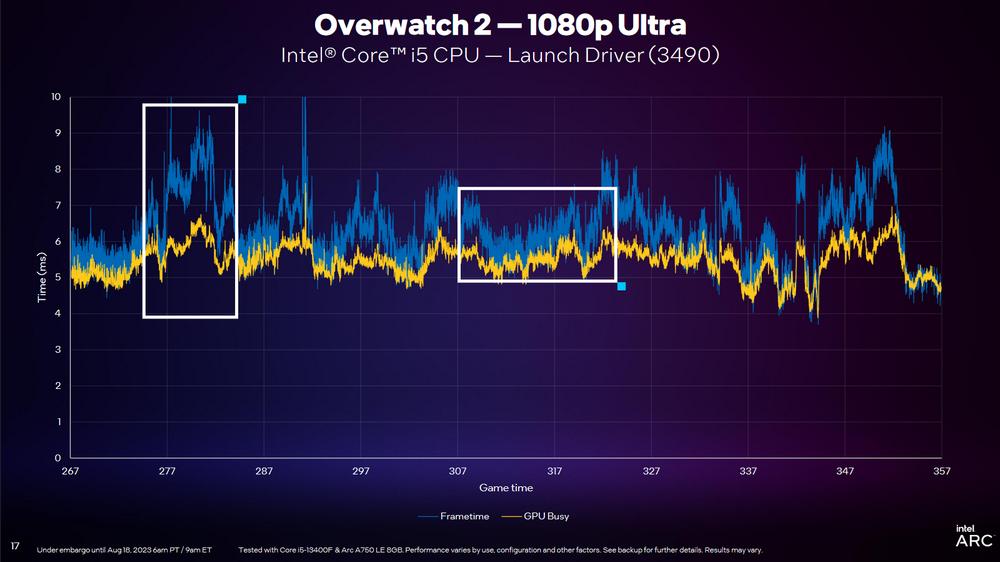
Alongside these performance advancements, Team Blue has unveiled a updated version of PresentMon. The software now allows users to see what Intel calls a ‘GPU Busy’ metric, i.e. GPU load compared to CPU, in order to find out what is bottlenecking the system. PresentMon is multi-vendor compatible, meaning AMD Radeon and Nvidia GeForce users also benefit.
In the example shown by Intel we can see a discrepancy between frame time and GPU Busy, indicating untapped GPU cycles, resulting in wasted performance and the possibility of stuttering.
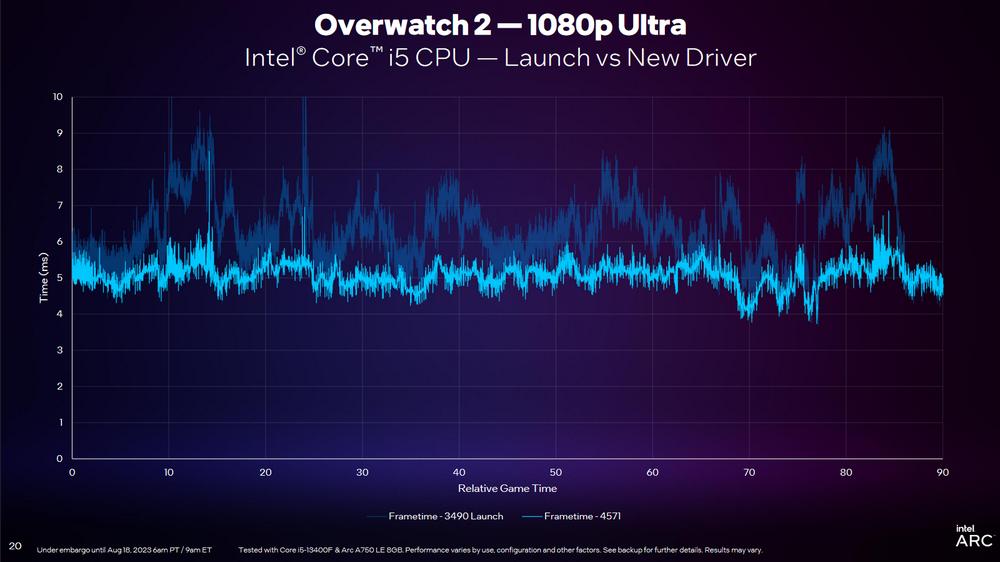
With new drivers we can see how frame time and GPU Busy lines are closer aligned, meaning the GPU is not waiting for the CPU to finish its calculation to begin drawing a new frame. The new-driver graph also shows how frame times are much smoother, resulting in less stuttering.
A handy tool, but GeForce owners should note that frame generation or latency reduction technologies such as Nvidia’s DLSS 3 and Reflex can influence these results, causing unreliable reporting.
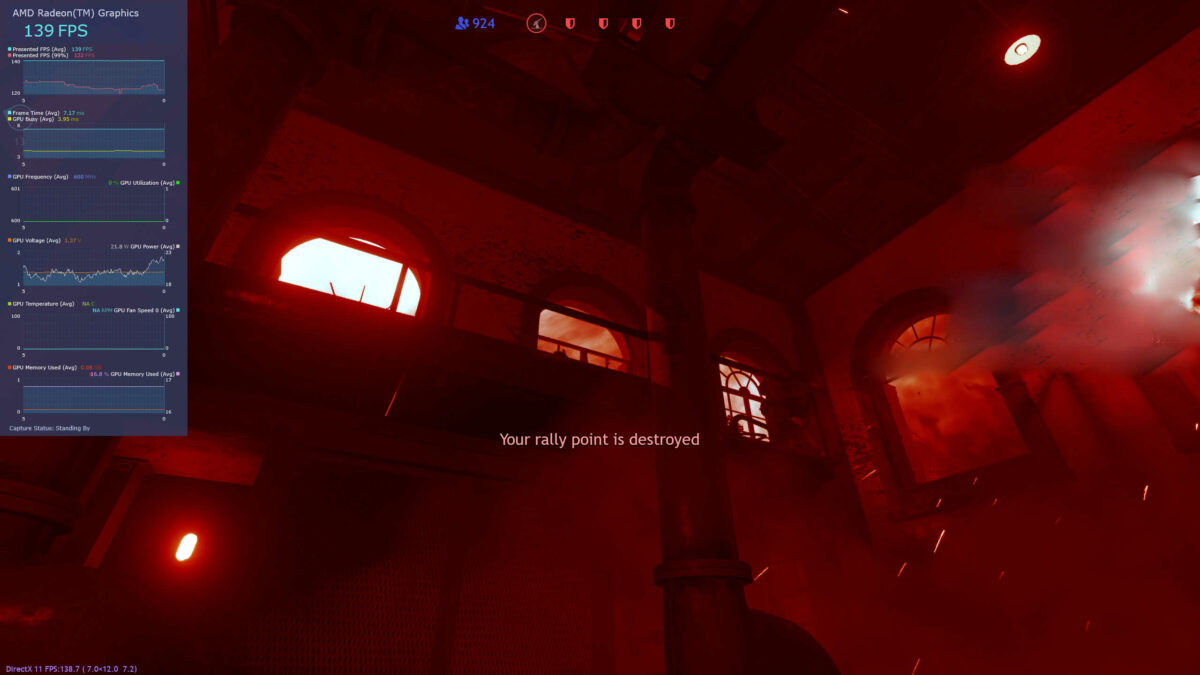
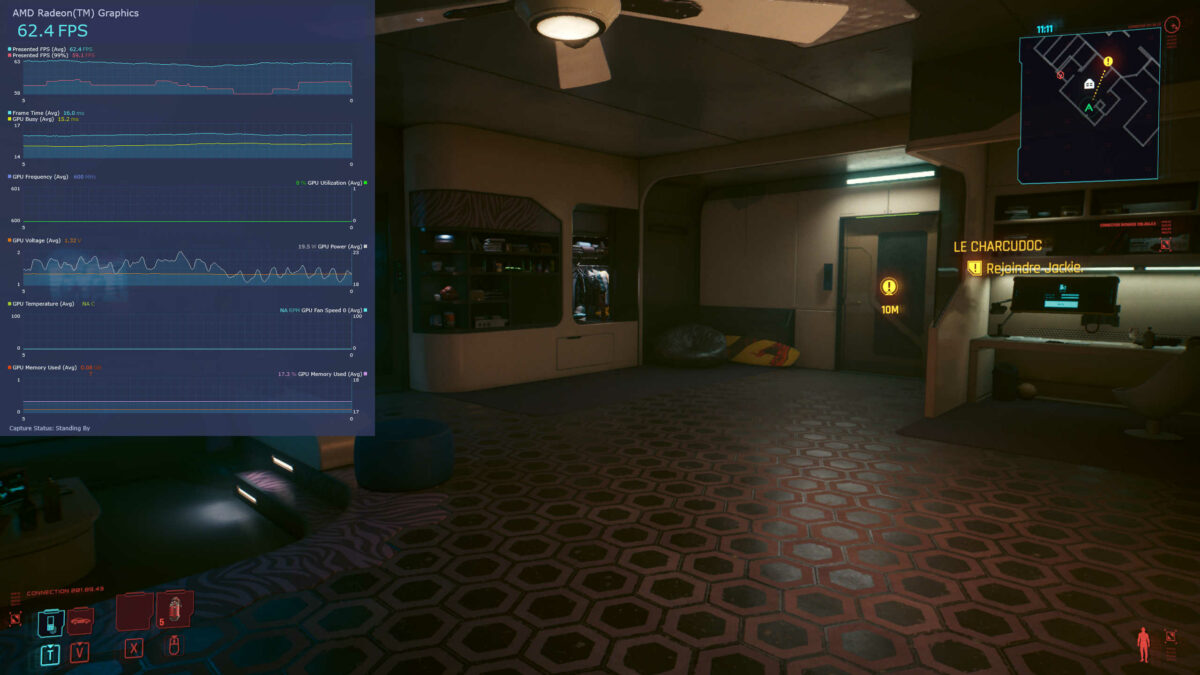
I downloaded and tried an early release of the updated PresentMon app in a couple of games. In Enlisted, pictured below, we can see GPU Busy is more than half that of frame time which means the GPU is idling most of the time, which is correct since I capped frame rates to 140fps. At the other extreme, I tested Cyberpunk 2077 with ray-tracing enabled which averaged around 60fps (16ms frame time), here GPU Busy was less than a millisecond apart indicating high GPU utilisation.
From my limited testing using my newly upgraded PC powered by an AMD CPU and GPU, I did stumble across two small bugs; one causing the overlay to stick to the wrong windows – mainly on games with dedicated launchers like Cyberpunk 2077 and Anno 1800; and another causing the wrong GPU to be monitored – iGPU instead of dGPU, though frame times were still correct. The former was easily fixable by launching PresentMon after the game, but I have yet to see if there is a way to fix the latter. Other than this, for beta software, things worked smoothly.
Intel isn’t reinventing the wheel here, as there are many existing tools that can display such data – CapFrameX comes to mind – but PresentMon displays the relevant points in a fashion that is easy to understand even for non-tech-savvy users.
In future iterations, Intel plans to add more ways to identify why exactly a game is CPU limited, whether it is fully loaded – meaning an upgrade may be needed – or just that the CPU is waiting for memory or other parts to alleviate a bottleneck.
The PresentMon beta is available to download at game.intel.com.